

Cracking the Code: How Modular Analysis and Data Integration are Revolutionizing Spatial Biology
Scientia in forma data: Researchers are collating data and using multiple lines of investigation to understand the complexities of tissues.

Dear Community,
Like the post last week, We will look at two papers that have been published (One a preprint and another reviewed) recently. We have hit a new milestone; we as a community are 100 members strong. I am thankful for every one of you who is part of this journey, We will press forward and not stop in this journey; The journey of getting the word out about bioinformatics and computational biology. I am excited and pumped for what is to come, keep an eye on the blog as the days go I will strive to provide more value to you all (we have some exciting collaborations in the making). There will be a small change in the schedule of the post, From now it will be delivered at 11:30 UTC+1. With that said, I call for your action
Ask your colleagues or friends who are interested in these topics to subscribe.
Tweet and share the post on your social media platforms such as LinkedIn or Twitter.
Participate in the subscriber chat. You will find the buttons to do this along the way.
Together let’s progress, take strides and let us get informed!!
Stockholm, 2013; A grey Friday morning is the usual trend that arrives in the Swedish winter setting. I was attending a weekly research update of the lab I was part of. During one of the presentations by a colleague, our professor who was leading the research team interrupted the presentation and said something profound. It has stuck to me, probably not the exact words
“In research, the scientistmust don the hat of a sleuths deconvolving a mystery. You have to gather multiple lines of evidence for your hypothesis, data is your weapon and with accurate data, you can even convince a determined sceptic.”
The statement was significant to me as a budding research enthusiast who had just completed my Master's. It fundamentally altered my viewpoint on science by emphasizing the importance of testing and challenging hypotheses with different experiments. It is crucial to gather all available evidence and employ all accessible methods to support one's hypothesis. Furthermore, I realized how vital it is to test a hypothesis in various systems, as it provides an extensive overview of the processes being studied and leads to a robust discussion.
During the COVID-19 pandemic, bioinformatics played a vital role, in my opinion. Nextstrain, one of the first websites to track viral evolution based on publicly available sequencing data, provided a real-time view of viral evolution, which would have been inconceivable a few decades ago. Scientists also used various sequencing-based technologies to understand the disease's mechanisms of action.
The paragraph above highlights two features: publicly available databases and the use of sequencing-based or Omics-based methods to study the disease. The scientific community's recent efforts to share the data generated with other scientists and create user-friendly tools to explore complex datasets are monumental shifts in opening up science to curious individuals.
In this light, For this week's post, I want to highlight two papers which struck a chord with me and I hope that I can navigate you through what they have to offer for us as a curious person and how we could use it in a thought experiment of our own,
A Robust Platform for integrative Spatial Multi-omics Analysis to Map Immune responses to SARS-CoV-2 infection in Lung Tissues
SODB facilitates comprehensive exploration of spatial omics data
COVID-19 was absolutely devastating for several of us, It was a disease that we will likely remember throughout our lifetimes. As we live through the transitionary age “post-pandemic”, our thoughts sway back to look at a time when we restricted our movements severely and relied on technologies to guide us through a difficult time. This devastating respiratory illness has put into focus our urgent and dire need to fund and perform research in virology. A few years back, virology was pretty much relegated to an ageing field. I personally found it difficult to find funded PhD positions in this domain since It was and still is a subject I love. Viruses are essentially a package of genetic code along with a shell of protein that is marvellous in commandeering the host cells for their one and only purpose; Replicate as fast as it can before the immune systems figure out how to chase them away.

Traditional approaches to studying viruses were a labour-intensive process of obtaining the sample tissue infected with the virus, this was usually followed by an enzymatic step to digest these tissues and generating cell cultures where the isolated particles were infected to an established cell line with the hope that the virus can enter the cell if the cell expressed the required receptor or you infect a variety of cells to identify which cell can be infected and one then proceeds to study its functions further. For observational studies, Electron microscopy is the gold standard. Developed in the 1930’s it allowed tissues to be fixed and then imaged by bombarding them with electrons. The structure of the virus particle then allowed the researchers to distinguish which virus it is likely to be. You can find further methods to study viruses here.
Now with the advent of Next generation sequencing, the steps are much simpler. The researchers need a small biopsy of the infected tissue from which they extract the total genetic material and perform DNA/RNA sequencing. This was key behind the rapid tracking of SARS-CoV2, Similarly for the first time during the pandemic we saw an increase in the number of publications using scSEQ technologies to understand the complex nature of the disease. In a similar light, there were a handful of papers that looked at the spatial profile of the tissue and how the interactions between cell types look under the disease condition.
We should realise that once an infection is underway, the body’s inbuilt mechanisms to protect it kick in through a series of signalling cascades initiating the immune responses along with various other responses to protect the vital organs required for us to survive. In the context of the pandemic, scientists were able to characterise the responses in general. But the current paper develops a robust platform for characterising these responses at a deeper level.
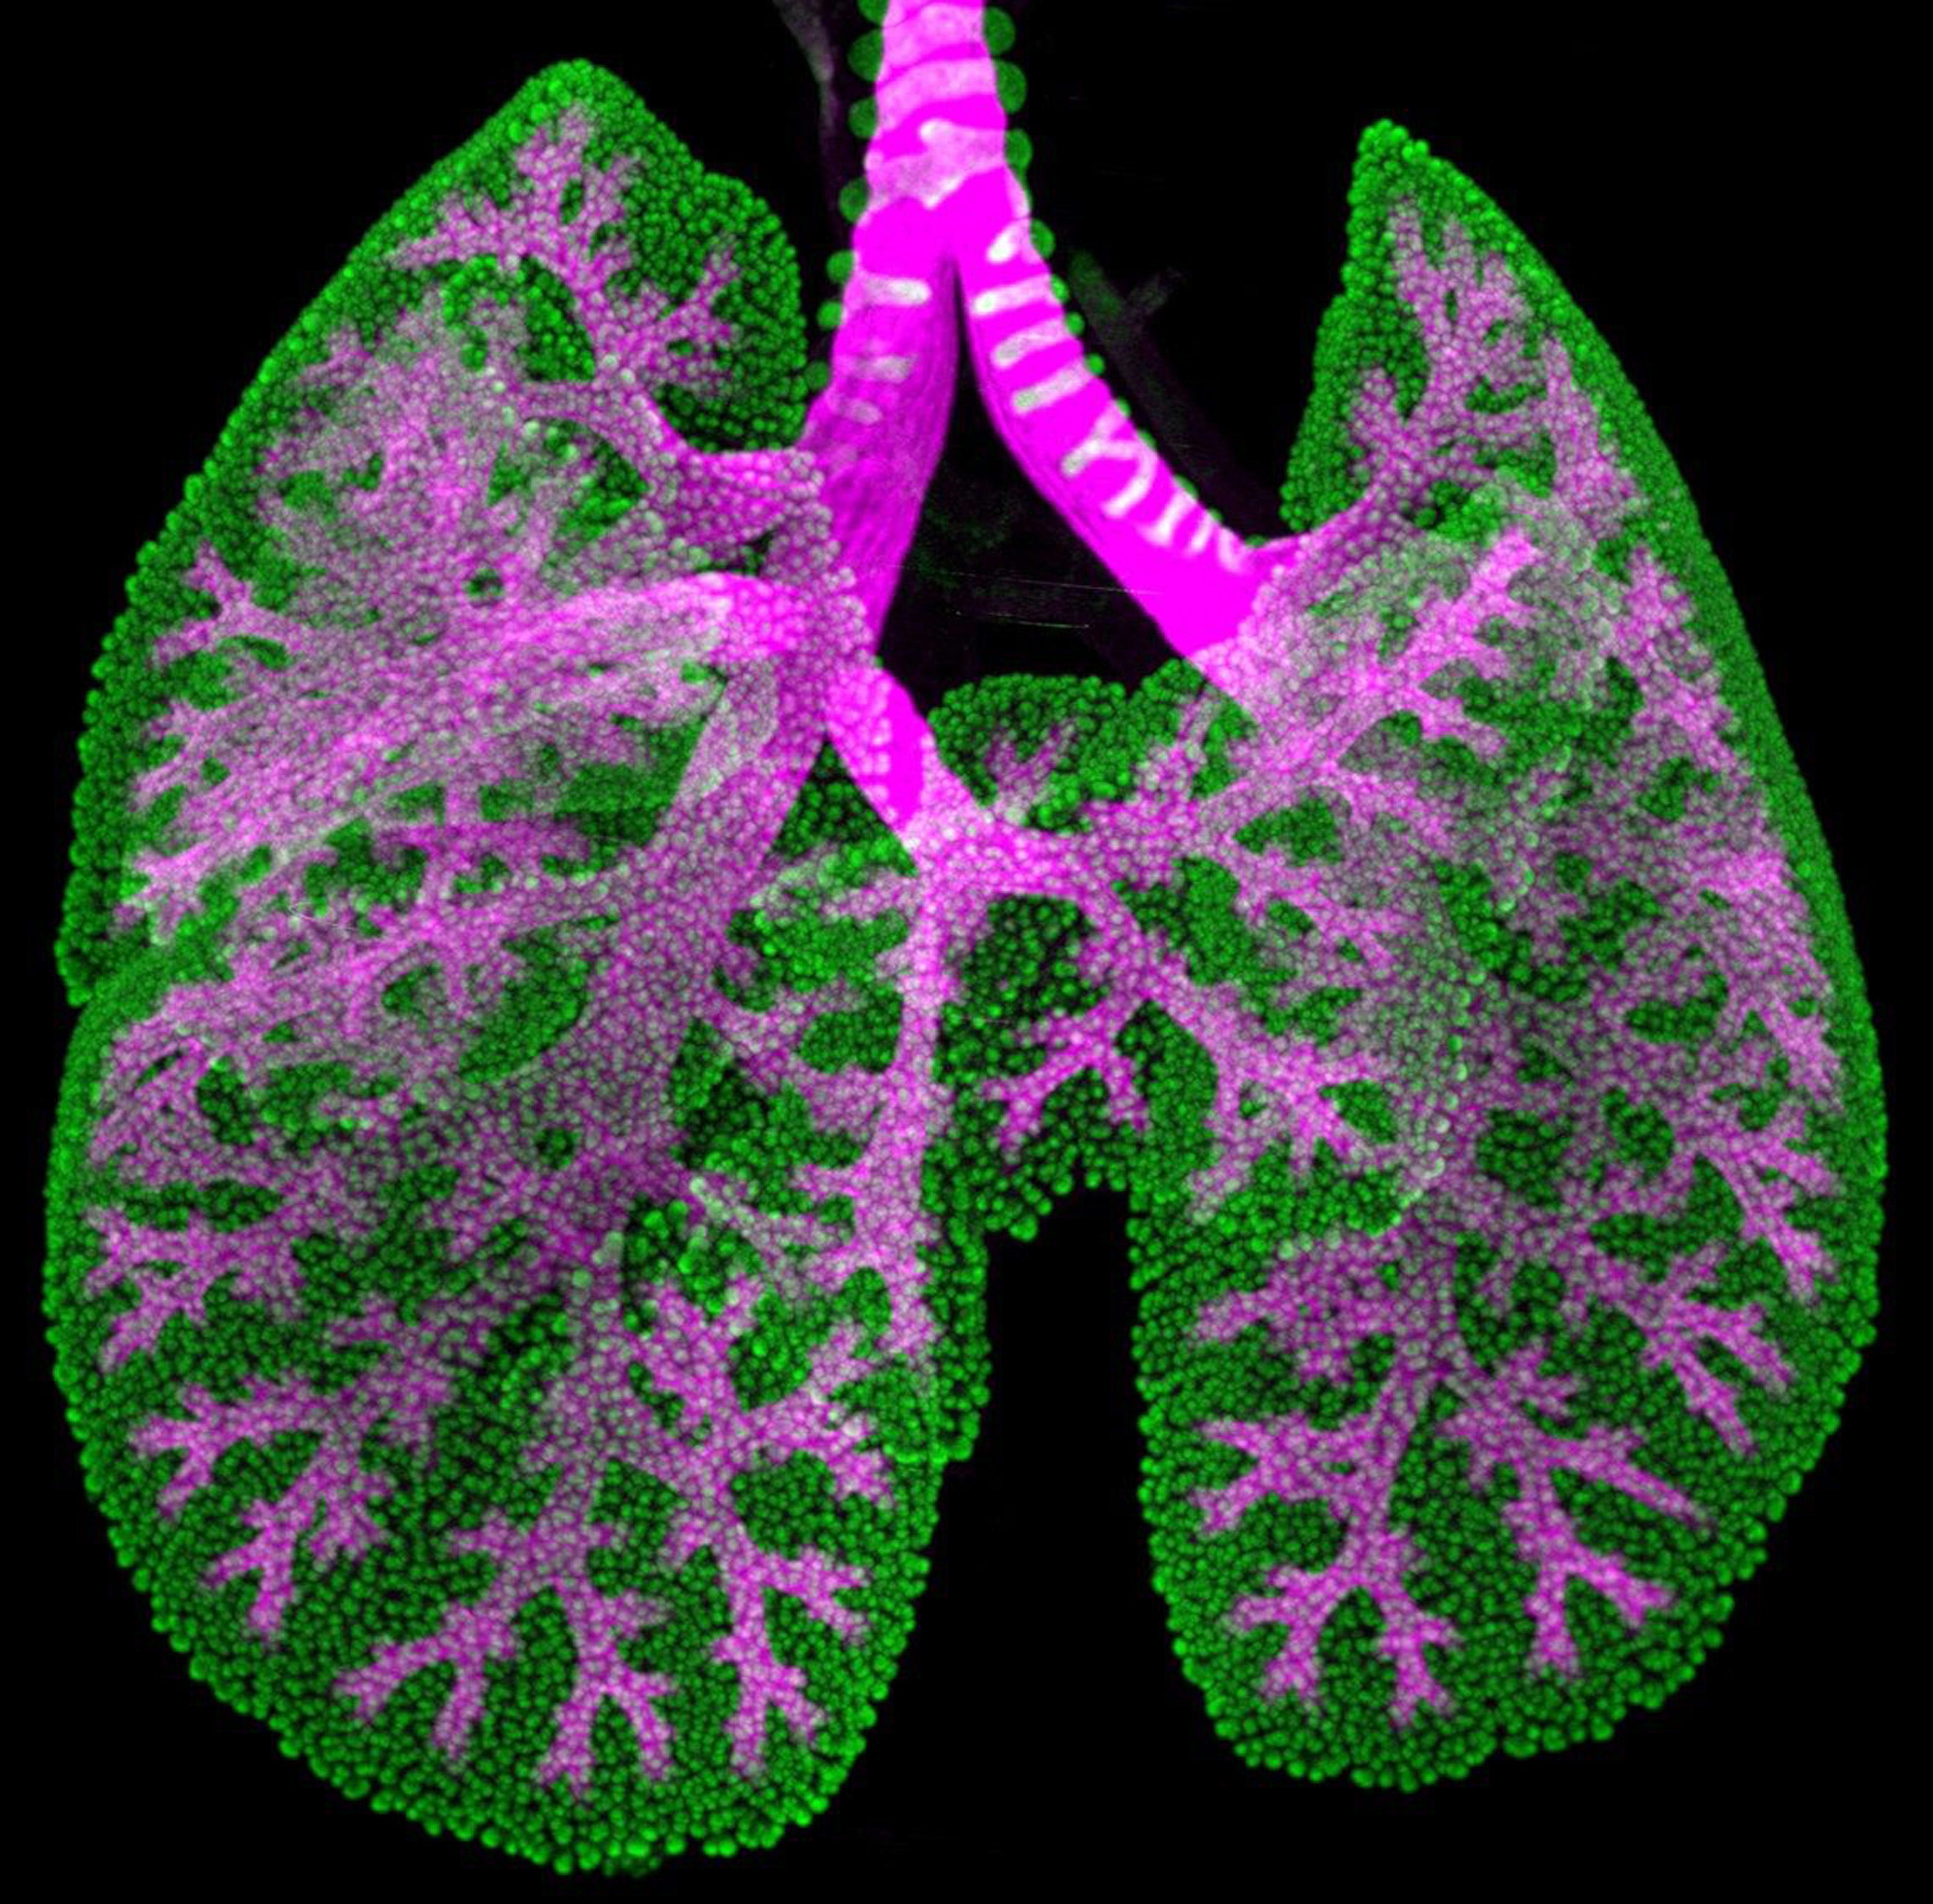
By using five tissue profiling technologies and developing a novel computational mapping method, The authors propose to comprehensively characterise and compare the transcriptome and targeted proteome of virus-infected and uninfected tissues. This paper demonstrates the integrative approach to gain a deeper understanding of viral effects on cellular environments at the site of infection ie., The lung and how SARS-Cov2 impacts the lung.

Even now, after almost 3 years of intense research, we still are discovering novel mechanisms by which the disease targets our lungs, To understand the need to use multiple methods we will go through some key points the authors point out, preceded by their experimental design.
Experimental Design and reasoning
Utilization of 5 spatial-omics technology to the same tissue biopsy provides complementary information about RNA and protein expression at different genetic resolutions.
Spatial Profiling of blood vessels, alveolar type II pneumocytes, immune regions and epithelial tissue regions of patients with and without the disease to give a broad overview of what's happening.
They classify based on the viral mRNA of infected patients as high or low.
Computational pipeline enabled spatial integration of protein and RNA across tissue sections.
This allowed them to reveal cell types and molecular pathways of potential importance to virus pathogenesis.
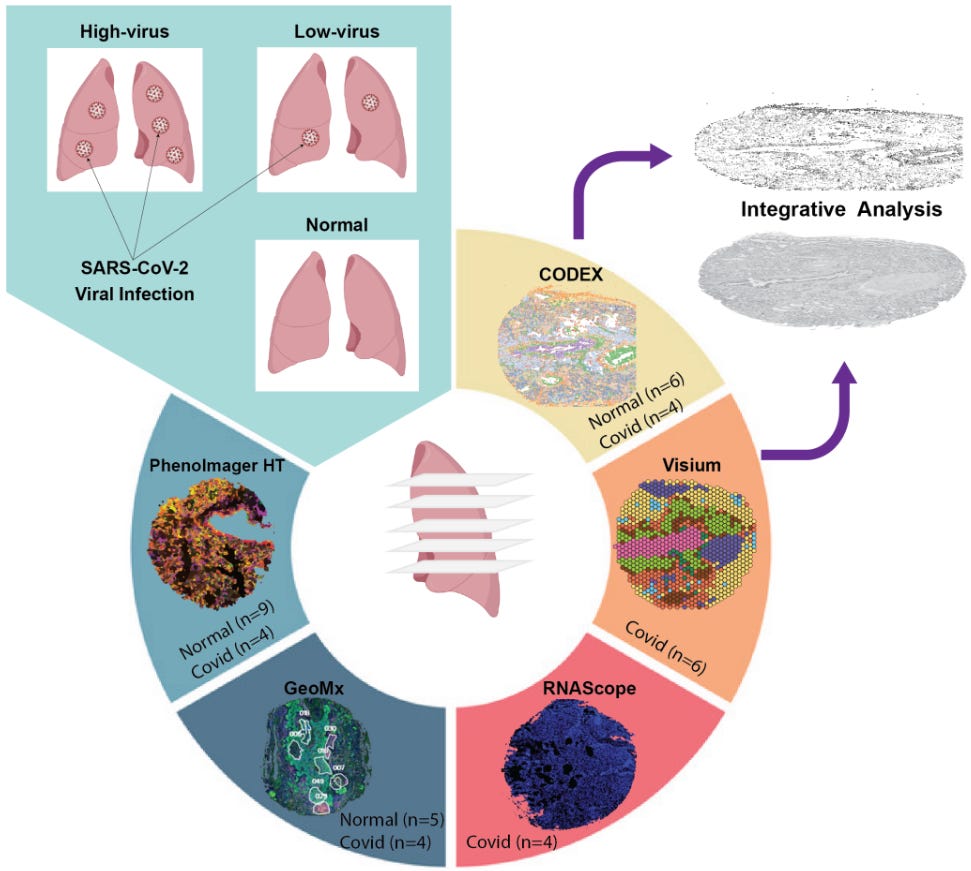
Building a multi-omics tissue atlas of COVID-19
Application of RNAScope to target SARS-CoV2 spike mRNA and quantification by STRISH pipeline.
This gave the authors an idea of the spatial location of the virus-infected cells within the tissue and they were able to categorise the viral load as low and high (two per category).
Visium data allowed them to compare the transcriptional profile in an unbiased manner for the four biopsy samples.
GeoMx whole transcriptome talas technology was used to profile 5 uninfected and 4 COVID-19 patients; Overall RNAScope, Visium, and GeoMx measured the RNA content.
Protein expression was measured using CODEX for 6 uninfected and 4 infected samples. Similarly to provide a higher resolution of proteins, imaging via PhenoImager HT was performed to detect 6 key immune markers for the following cell types
NK cells - CD56
Neutrophils - IFI27, CD15
Granulocytes - CD66b
cytotoxic T cells - CD8
T cells - CD3
Using the integrative approach they identified 11 dominant cell types and three of these dominant cell types were shared across four patients.
They observed that cell type detection in Visium data is highly tissue specific. GeoMx data on the other hand uncovered high heterogeneity in cell type composition across different lung regions.
PhenoImager HT and GeoMX data suggest an increase in NK cells in COVID-19-infected samples. While GeoMX was able to capture CD4 T cells Phenoimager could not.
CODEX RNA data detected higher expression of cytotoxic T cells and PhenoImager HT showed higher neutrophils but this trend was not clear in GeoMX. This might be to the combinatorial system required to infer the cell types in GeoMX
Overall, this shows each technology has its own pitfalls. Just relying on a single method would leave us blindsided due to the complex nature of the disease and the limitation of the technologies. This is what it probably means to gather alternate lines of evidence and inform your hypothesis to refine it. It’s like looking at all the sides of a black cube to detect the side which provides the clues for the next puzzle, or the hints in the hit movie the glass onion one leading to another and in turn the story becomes much clearer.
Integration of multi-omic imaging data to cross-validate tissue types and spatial expression
Handling different data types is always a challenge in bioinformatics, each platform comes with its own quirks and data output, the authors claim to have developed an innovative approach to automatically integrate spatial multi-omics data based on cross-mapping tissue images and transferring assayed molecular data between samples.
They use image registration to cross-map Visium and CODEX data. this generated an integrated dataset anchored by H&E tissue images.
Three levels of information in the integrated dataset allowed them to analyse pathological annotation with transcriptome-wide gene expression data.
They were able to use CODEX single-cell markers to distinguish epithelial cells and smooth muscles in the tissue sections. The mapping-based approach allowed them to directly compare visium spots (see this post) that are classified as epithelial or smooth muscle cells to the CODEX data.
Basically, this analysis of comparing technologies with their “innovative pipeline” can cross-validate cell types across various technologies.
They further look into macrophage distribution and measure it across the high or low infection status. They observe that a higher viral mRNA signal was enriched in both the technologies with high infection status.
Overall, They claim to have confirmed cell type integration from spatial transcriptomics has a high correlation to protein signals.

Opinion as a bioinformatician:
Although I was initially excited to see multiple techniques and platforms being employed, this paper has not been peer-reviewed. I certainly see a few pitfalls, Let me know what pitfalls you think I might have come across.
Code: I wanted to check the code and how the pipeline was designed, At this stage, they claim an innovative pipeline but do not provide a working GitHub repository. ⛳⛳⛳ This is a red flag for me.
Most approaches claiming innovations of late come with some mathematical iteration that slightly improves the data processing or as in previous posts derives new knowledge. This study is limited in that scope, there are few claims but no cross-validation. It might be likely that this will be addressed in the peer review.
Amongst methods, they touch upon several algorithms and methods they used of which nothing seems to scream this is extraordinary. There is a whole paragraph on DE analysis this is slightly redundant at this point, I think the provision of appropriate code and its implementation in a jupyter notebook should give us a better idea rather than this paragraph.
I feel this paper is more of a platform demonstration exercise rather than asking a truly relevant question in terms of say, how does signalling within these high and low viral infections differ, What sort of transcriptional and or damage markers can be understood? These markers could, in turn, provide us with crucial information and we could leverage these markers as a proxy for disease severity and in conjunction with survival analysis provide a piece of meaningful information for the clinics.
SODB facilitates comprehensive exploration of spatial omics data
I have briefly overviewed various spatial Omics platforms in the multipart series (link 1, link 2, link 3). It is an exciting new field which generates a rich and highly complex dataset. To anyone who would like to explore the publicly available data and analyse the dataset, there is a steep learning curve with the available tools. Imagine if you are performing an experiment with your favourite gene and you would quickly like to look at the spatial expression of the gene in multiple tissue contexts. One of the approaches would be to gather all the data types across platforms and comb through them one by one to see the gene expression pattern. But this approach is tedious and time-consuming, Heck even installing required packages for the analysis is time intensive. Would it not be easy if there was google for spatial Omics data where you can pick and choose your tissue of interest and gene of interest and carry on with satiating your curiosity or even come up with a new hypothesis of your own?
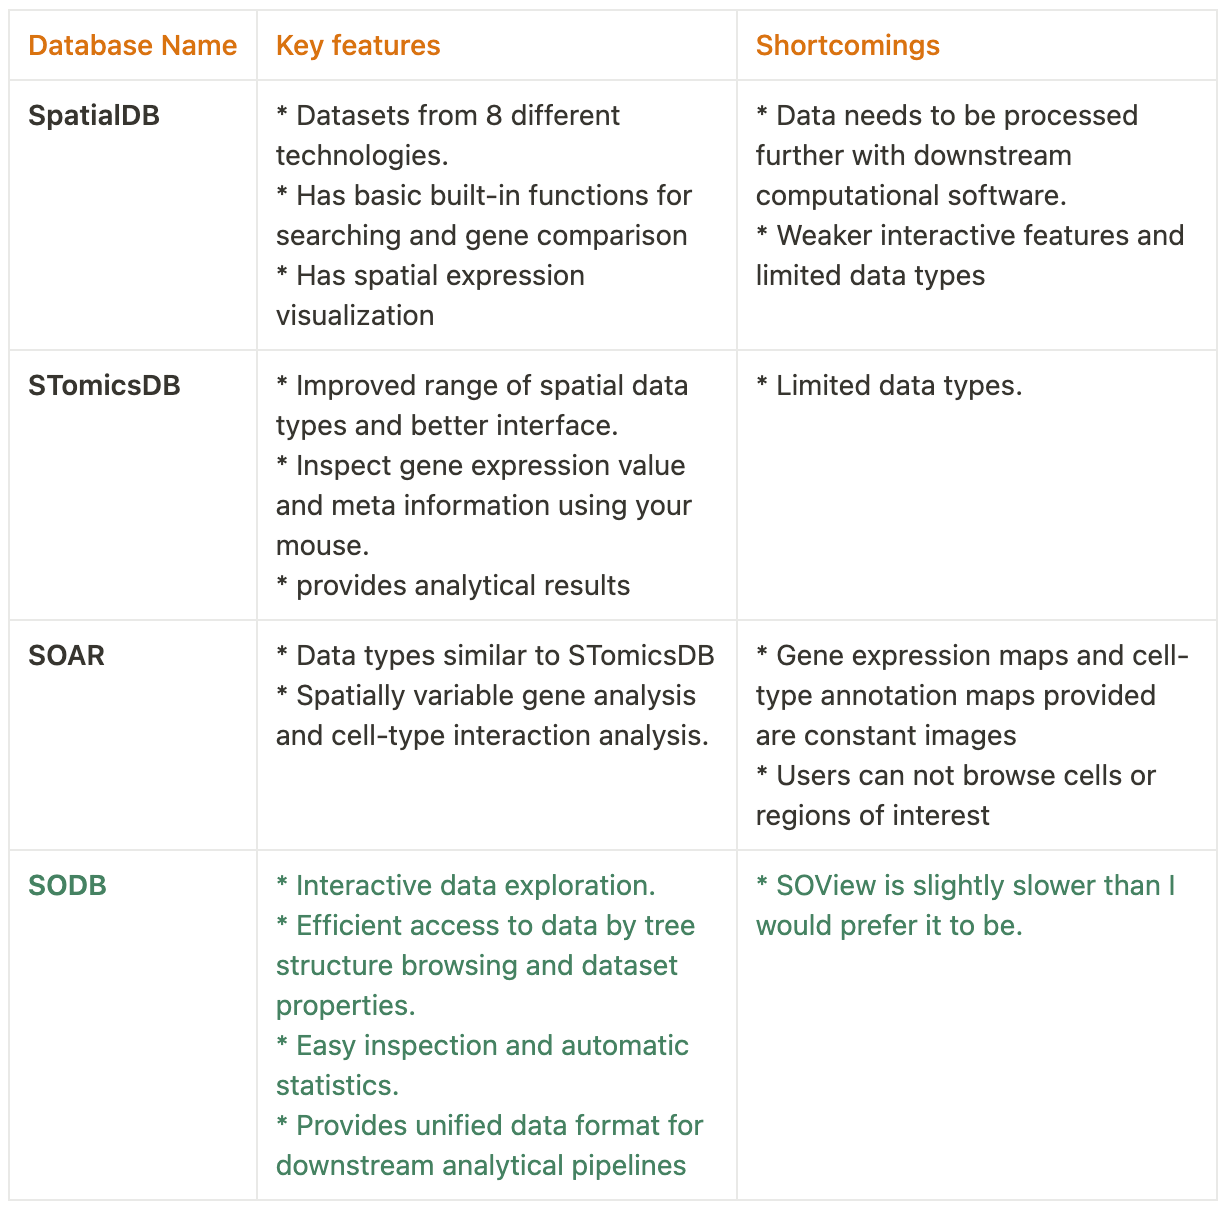
Enter, SODB a web-based platform that provides data resources and a suite of interactive data analytical modules for spatial Omics.
Data organization and characteristics
The authors organized the data using a hierarchical tree structure containing five levels,
Root
Biotech category: classes of spatial technologies.
Biotechnology: specific spatial technologies.
Dataset: Multiple experimental replicates etc.,
Experiment: a single slice of the experiment.


This can be accessed via the graphical interface as well as the command line interface. Their major claim is the efficiency of accessing and loading the data on personal computers(check the gallery above for metrics).
The data consists of more than 2000 experiments of tissue samples from seven different species with mouse and human samples dominating the datasets. As per the authors, brain regions are the most studied using spatial omics technologies followed by the liver and heart. The data also consists of cancer tissues, with breast and colorectal cancer being prominent targets for spatial omics studies. On spatial transcriptomics data, MERFISH was the predominant experimental methodology followed by commercial platforms such as MIBI and CODEX.
All sequencing-based spatial transcriptomics studies showed high data sparsity, ie., a percentage of zero entries in an expression matrix this is expected in platforms such as Visium as it is an untargeted approach. Whereas, Imaging-based spatial transcriptomics approaches have lower sparsity since they are targetted and have higher mRNA capture rates. On a similar note, spatial metabolomics exhibited larger sparsity compared to proteomics.
Data exploration
SODB provides an interactive and convenient way for exploring the data. it is accessible at https://gene.ai.tencent.com/SpatialOmics. The expression view can be used for looking at the expression values of selected genes one gene at a time and it provides a drop-down menu format for exploration.
The annotation view can be used to explore the spatial distribution of the selected property of a spot. The property can be a cell-type annotation, tissue-domain annotation etc. It also provides a hover-and-click method to display annotation information and select regions of interest using the mouse.
The comparison view can be used to efficiently compare the relative expression levels of two selected genes and it shows their differences in space.
Opinion as a Bioinformatician:
The database seems to be a powerful tool to have in a bioinformaticians tool kit, I will be playing with it and see its quirks and what the advantages and shortcomings are in the upcoming weeks.
By providing a unified format for the data, reduces the computational time required to convert data formats to fit into a pipeline such as SquidPy and makes my life easier. although the quirks of obtaining the data through the command line need to be tested by me and others.
I am glad to have discovered this now since our lab is planning to dip our toes into spatial omics and work on a small project associated with spatial transcriptomics.
I will keep you folks updated in the subscriber chat once I have implemented this into my workflow and let you know tips and tricks, so stay tuned.
A brief summary,
We have seen two papers that leverage the multiple platforms available in spatial transcriptomics to address different issues. The first tried to integrate the data types and the second created a database so that the users can efficiently query data. These approaches are common in the field of bioinformatics and provide useful tools for us as researchers and individuals to approach our own experiments.
Now that you are better informed, go ahead and play with your hypothesis at the SODB interactive platform and leave me a note on what you have discovered.
References:
A robust Platform for Integrative Spatial Multi-omics Analysis to Map Immune Responses to SARS-CoV-2 infection in Lung Tissues. Xiao Tan, Laura F. Grice, Minh Tran and co authors. Pre-print link
Yuan, Z., Pan, W., Zhao, X. et al. SODB facilitates comprehensive exploration of spatial omics data. Nat Methods (2023). https://doi.org/10.1038/s41592-023-01773-7
If you enjoyed the article, Please leave a like and comment below. And if you appreciate the work, maybe scan the QR code and buy me a coffee.
See you next week with a cool new paper on a similar technology that is going to change the field.
