

In-silico perturbations: leveraging single cell seq to perform perturbation experiments
Omnia mutantur: How researchers are using computational models to predict cell fates, And their regulatory networks.

Dear Community,
Like the post last week, We will look at two methods that have been published (One a preprint and another reviewed) recently. I am calling the 76 members of this community to share your curiosity and enthusiasm about science and the field of bioinformatics by just doing one simple thing. Talk about our newsletter to your friends or colleagues, and show these posts to them and let them join our exciting adventure into the unknown. You will find the buttons to do this along the way as you read through. Also, I would recommend using the browser for this read, its a bit longer than the previous one.
Let’s Go!!!

I am a machine, possibly an improbable one but yet I exist. Through careful orchestration of phenomena that I have evolved over millennia, I serve to exist. I evolve, change, adapt and mould myself. I am made of interesting components, Each of them does not know why they are there by themselves but I encapsulate them into a neat little package a robot of sorts to survive is my prerogative; For I am a cell.
The biological world and its “umwelt” (my new favourite german word) is as complex as any star system or galaxy that exist. I often marvel at the complexities in the packages they come in; Not only that they are usually tiny (of course we have extreme outliers as well) but they are especially well-tuned machines that perform complex tasks within their tolerances to what I would consider near perfection.
It is likely that you had taken a biology lesson in the past to have come across two of the plethora of these sub-machines that are of interest in this week's edition of the newsletter. They both are in a way consequent steps of the process by which your cell’s DNA is converted into a final product the protein. Which in turn provides and contributes to the cell's function, identity and in-built mechanisms for overall production and regulation of the cell itself. Confusing?
Cells contain a nucleus: This package has your genetic information the DNA.
Through a complex orchestration of events, DNA is then converted into RNA and then the protein.
The proteins in turn can dictate the fate of the cell and the triggering of events that might lead to the propagation of the cell.
So with this out of our way, let's dive into two recently published methods that aim towards a computational approach to perturb steps of the “cellular information highway”.
Dissecting cell identity via network inference and in silico gene perturbation.
Compressed Perturb-seq: highly efficient screens for regulatory circuits using random composite perturbations.
Dissecting cell identity via network inference and in silico gene perturbation.
The original cells are but two, the sperm and the egg and the series of events that occur when they meet is an epic in the making. A careful orchestration of events, one such pivotal event is the activation of transcription factors. They are the gatekeepers of sorts that allow for the expression of specific genes, they fine-tune the expression of the genes allowing the exact specification of the cell fate i.e., which cell belongs where and its function.
Classical experiments that try to study the functions of transcription factors utilize one or many of the perturbation methods such as Genetic knockouts, Chemical inhibition, and Overexpression to name a few and observe the outcome of these experiments on the cell behaviour. But as one can imagine, these methods can be tedious and require thorough investigation so that the off-target effects of these interventions are minimized and our interpretation can be robust.
With the advent of single-cell technologies especially when it comes in conjunction with CRISPRscreens could be used to analyze the functions of transcription factors in the context of cell identity. Many computational methods that try to address the cell fate problem have their limitations.
The current study approaches this problem in the context of gene-regulatory networks (GRN). GRNs are models of how genes interact with each other and regulate the expression of other genes in a cell. I would compare this with your smart home network; Each and every instrument interacts with this network and thereby consumes bandwidth but by turning on and off certain devices it is possible to prioritize tasks on one device or the other. Similarly, GRNs comprise of a network of transcription factors(TF), proteins and other molecules that interact in order to control gene expression.
The use of GRNs inferred from single-cell multi-omics data to perform in silico transcription factor perturbations is the main aim of the paper, and therefore, one can simulate the consequent changes in cell identity using only unperturbed wild-type data. So how do they do this?
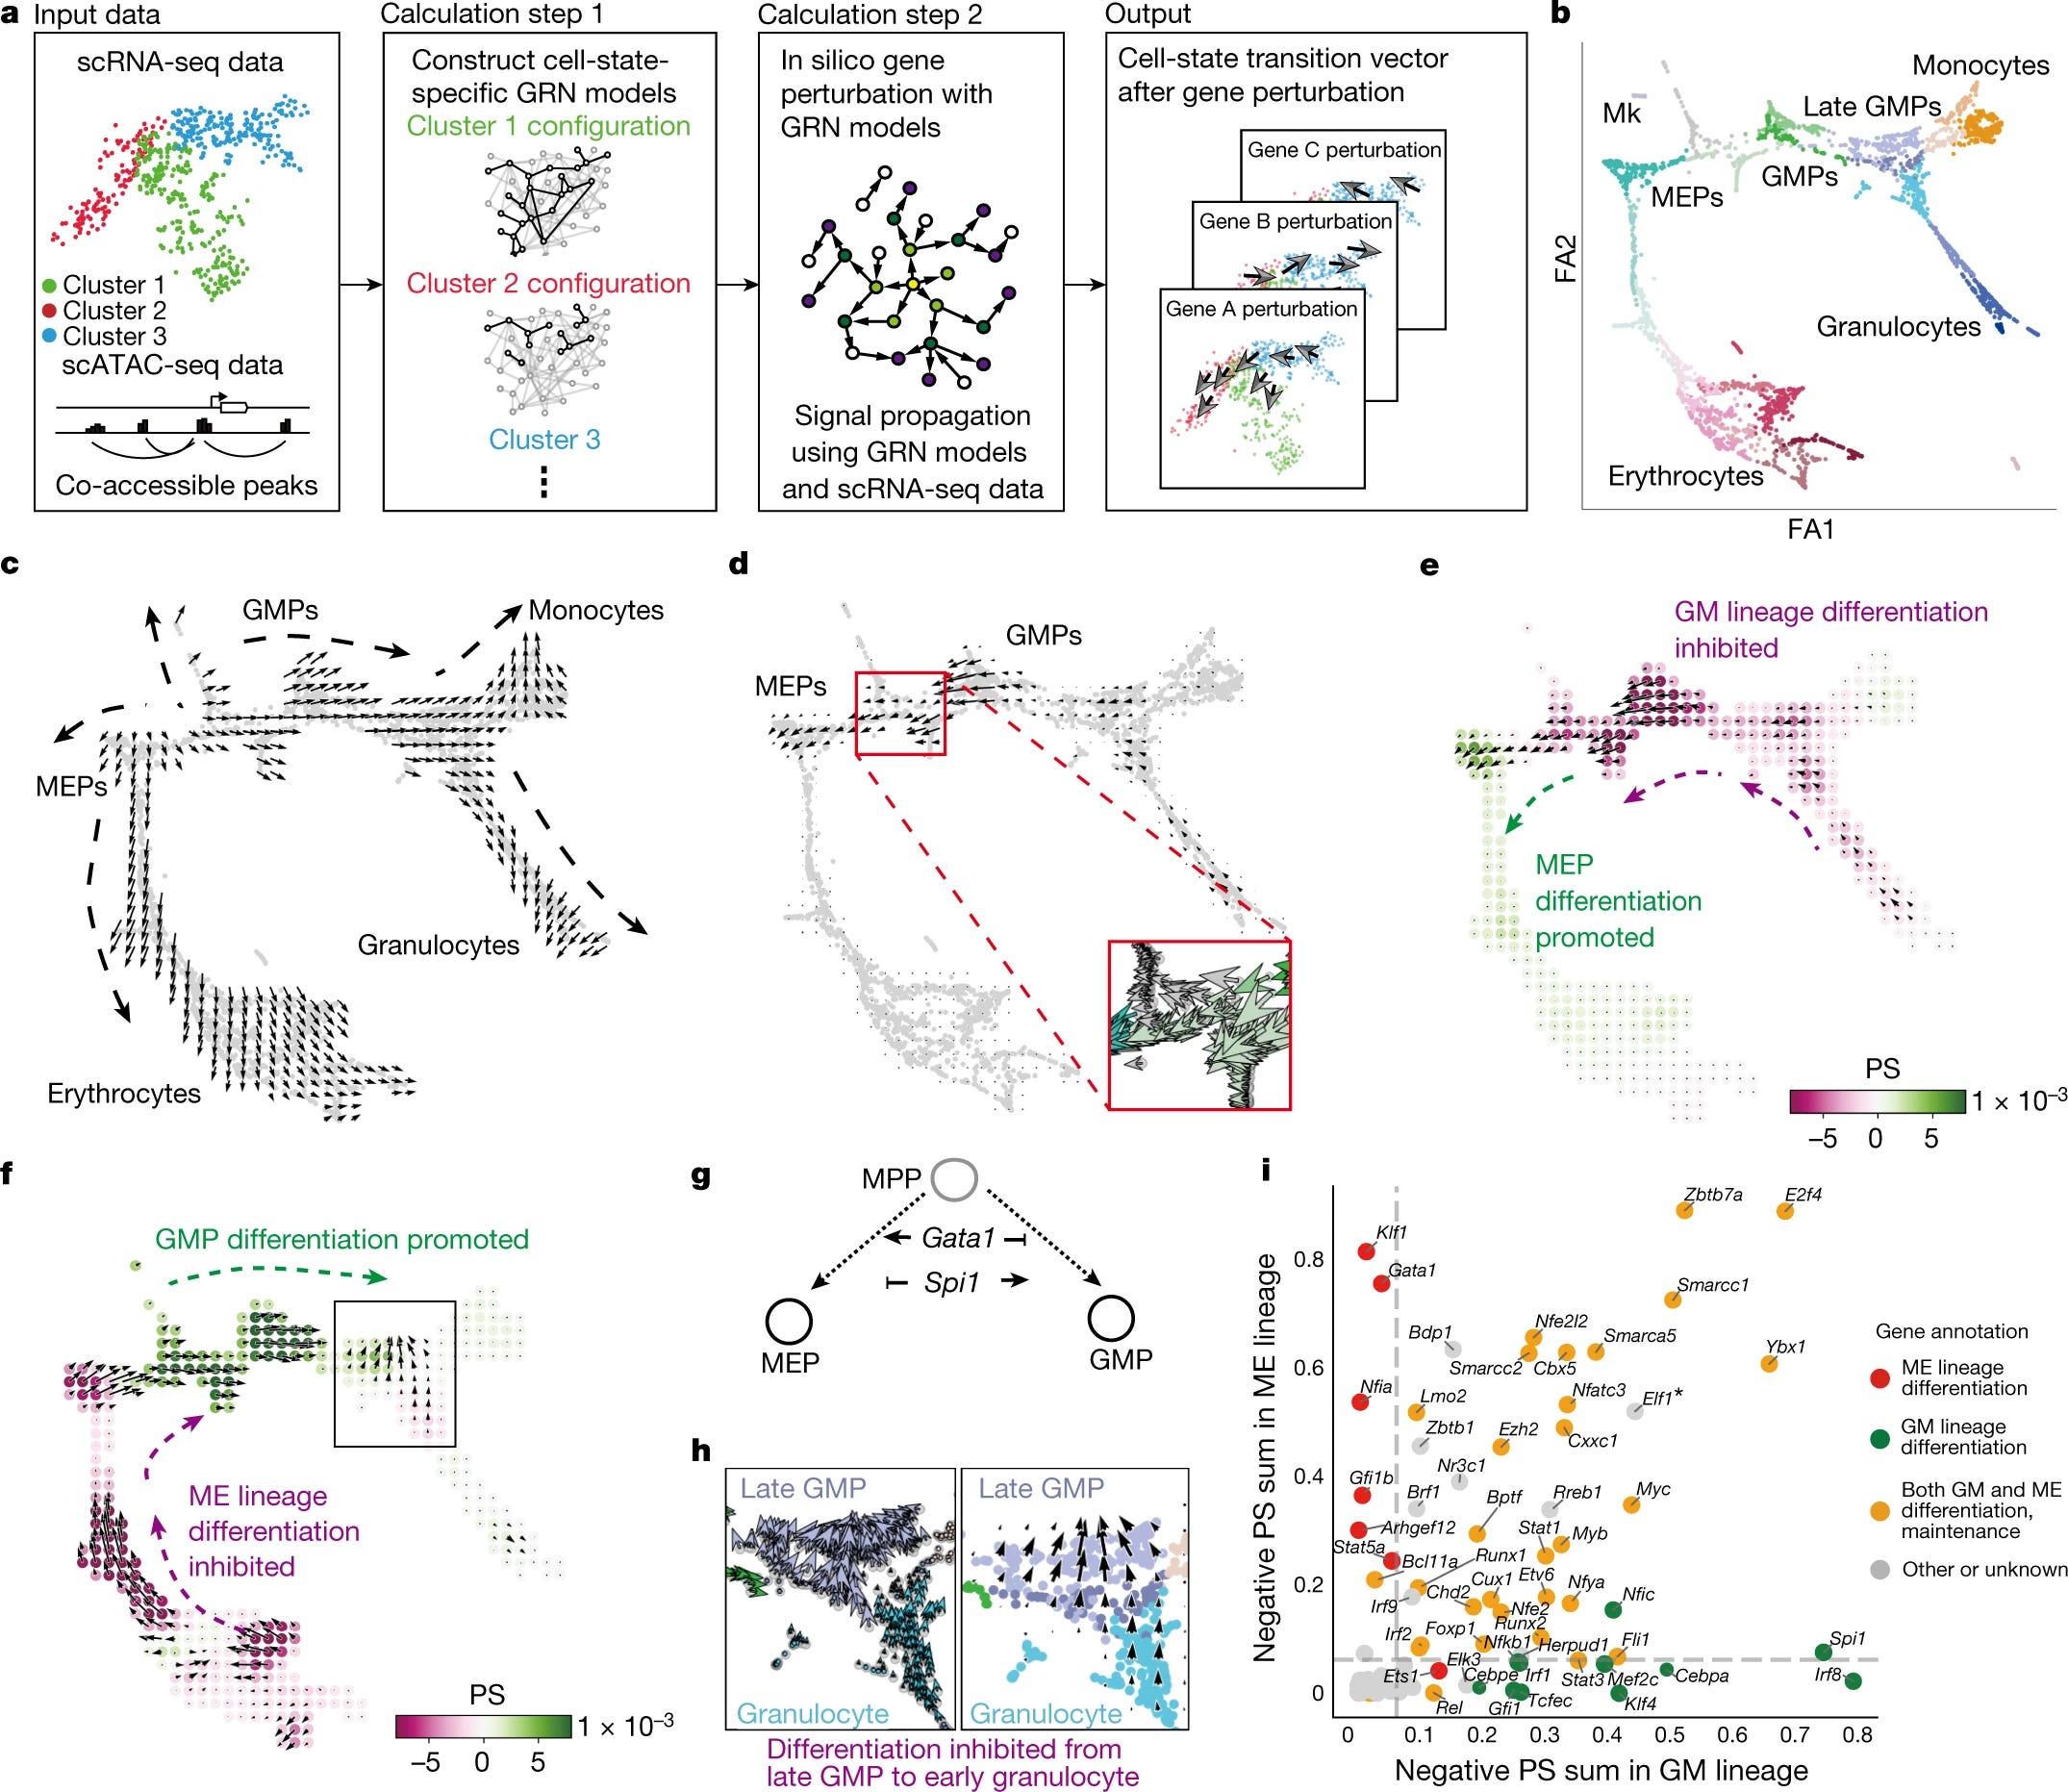
CellOracle, the tool they created uses a custom GRN modelling that stimulates the global downstream changes in gene expression following a TF knockout or over-expression. The insilico perturbation involves four key steps:
Construction of Cell-type or cell-state-specific GRN configurations using cluster-wise regularized linear regression models with multi-omics data.
By using these GRN models, shits in target gene expression in response to TF perturbations are calculated. This shift propagates the shift in expression of the gene rather than a change in absolute expression, ie this seems to be a sort of a proxy estimation of by how much the gene moves in a direction when TF is perturbed. Giving us hints to calculate the broad downstream effects of TF perturbation.
The cell-identity transition probability is converted into a weighted local average vector. This simulates the directionality of cell-state transition for each cell following the perturbation of candidate TFs.
Then the multi-dimensional gene expression shift vector is reduced to a two-dimensional vector for robust predictions.
The clear aim is to determine for a given transcription factor X in cell state C when perturbed what is the change ∂X on
The clear aim is to determine for a given transcription factor X in cell state C when perturbed what is the change ∂X on ∂C and not measuring the induced gene expression of the genes in cell state C.
Inference and benchmarking of the model:
Overview of Step 1 of inference:
CellOracle uses scATAC-seq data to identify accessible promoter and enhancer DNA sequences. This data allows them to construct a base GRN model.
The Transcription start sites are obtained from HOMER and by using Cicero to identify the co-accessible scATAC-seq peaks the authors are able to distinguish accessible promoters and enhancers.
The DNA sequences of these elements are scanned for TF-binding motifs, generating a base GRN structure of all the potential regulatory interactions in the species of interest.
The benefit of the process is to narrow the scope of possible regulatory candidate genes before model fitting, This also helps to identify and define the directionality of regulatory edges in the GRN.
All base GRNS are built into CellOracle library and provide an alternative solution when scATAC-seq is not available. This is the key advantage of using this tool when you don't have access to scATAC seq experiments.

Overview of Step 2 of inference:
The authors use scRNA-seq data to identify active connections in the base GRN.
This generates cell-type or cell-state-specific GRN configurations for each cluster in scSEQ data.
Since CellOracle uses GRNs from the genomic sequence information and infers the structure and directionality, it does not need to know the cause of the directionality based on expression data.
It uses a relatively simple modelling method for inference: Regularized linear machine-learning model (see concepts in brief for an explanation)
This strategy allows signals above the transcription chain to simulate the TF perturbation.
The performance of this model was then assessed by Area under the receiver operating characteristics
The key claim is that by using CellOracle they can effectively interrogate a network within cells and therefore introduce perturbations in-silico that can identify cell-identity dynamics.
GRN analysis and TF KO in hematopoesis
Any method once proposed has to be tested. In this case, the authors do test it on a well-characterized differentiation paradigm. That is mouse haematopoiesis. The authors apply CellOracle to a 2730-cell scRNA-seq atlas of myeloid progenitors differentiation. To perform in-silico perturbations they constructed GRN models for each of the 24 myeloid clusters representing megakaryocyte and erythroid progenitors (MEPs) and granulocyte-monocyte progenitors (GMPs) which are differentiating toward erythrocytes, megakaryocytes, monocytes, and granulocytes.
By using CellOracle they perform an in-silico perturbation analysis of Spi1 and Gata1 (both are well-studied transcription factors.
They devise a ‘perturbation score’ metric, which compares the directionality of the perturbation vector to the natural differentiation vector.
A negative score implies that TF KO delays or blocks differentiation, whereas a positive score implies loss of TF function promotes differentiation.
Spi1: the KO of this transcription factor yeilded positive perturbation scores for MEPs and a negative score for GMPs. These scores suggest that Spi1 KO inhibits GMP differentiation and promotes MEP differentiation.
Overall these results align with previously reported findings in experimental setups

Overview of CellOracle and its application in Heamatopoiesis. The figure broadly describes how CellOracle constructs the GRNS followed by mapping the clusters into six main cell types from scSEQ data. Overall we can see the differentiation vectors and how synthetic perturbation can be used to study the cell fate.
Similarly, they perform a wide array of in-silico transcription factor perturbations in different models and an array of transcription factors to show that their method is able to effectively simulate cell-state-specific TF function and corroborates with previously known knowledge of mechanisms that regulate cell fate in haematopoiesis and ground-truth in vivo phenotypes. The results also indicate that CellOracle enables objective and scalable in silico gene perturbation analysis. It has been used in an independent study in the context of human development; Where researchers applied CellOracle to understand medium spiny neuron maturation in the human fetal striatum. These are the cases where in-silico approaches can aid us in understanding
Not every method is one ring to rule them all, so every method has its own shortcomings. Similarly, CellOracle has the following limitations;
It visualizes the simulation vector within the existing trajectory space; therefore cell states that do not exist in input scRNA-seq data cannot be analysed. This makes me think, are there methods that impute unknown cell states in scSEQ data, if so can these methods be combined to unravel the Blackbox of transitional states?
TF simulation is limited by input data availability and quality, therefore a perturbation cannot be simulated if a TF-binding motif is unknown or TF expression is too sparse. This is challenging especially for less studied organisms which have low-quality data along with a non-robust description of TFs and their binding sites.

Compressed Perturb-seq: highly efficient screens for regulatory circuits using random composite perturbations
As we have seen above, perturbation experiments are quite important for understanding the processes that occur in the cell. Through perturbation, the functional changes in the cellular transcriptional direction and therefore the cell fate have been determined through a computational framework.
But what if you are an immunologist, and are interested to learn about cellular processes such as innate immune response and are planning to perform an interference screen on a library of targets? Here is where perturb-Seq comes to play.
Perturb-Seq (I am going to call this P-Seq in this article), is a relatively new single-cell sequencing method that enables screening in an effective way for regulatory circuits. This method is in turn a convergence of scATAC-seq, random composite perturbations, and scRNA-seq. It measures the effects of multiple perturbations in a single cell. Instead of multiple individual experiments which are often the case in traditional screening methods, P-seq leverages the methods aforementioned to efficiently measure the effects of multiple perturbations in the cells. By using single-cell versus the traditional bulk methods, we as researchers can employ this in several rare cell types for example instead of relying on established cell lines as a proxy.
The authors of the current paper, propose a new framework for P-seq, which aims to address the challenges of large-scale P-seq since they are quite expensive and limited by the number of available cells, especially for primary cell systems. By leveraging the technique of compressed sensing from signal processing, they provide us with an essential tool kit to be able to study perturbations in a more effective manner.
Why compressed sensing you might ask:
Generally, perturbation effects tend to be sparse in that most perturbations only affect a small number of genes or go-regulated gene programs (similar to GRNs above). Instead of studying and measuring individual perturbations, the authors suggest measuring a much smaller number of random combinations of perturbations and accurately learn the effects of individual perturbations from a composite sample using sparsity-[romoting algorithms. This might also allow us to efficiently learn both the single gene perturbations and what is the consequence and also the network interactions.
The authors propose two experimental strategies and an inference method to learn individual perturbation responses from composite samples. Using this framework they are able to give insights into immune regulatory functions and illustrate their connection to human disease mechanisms by integrating data from GWAS and eQTL studies.
For the sake of brevity of the article, and I have been tired the past few days (I am human after all) I will keep this section relatively short. I might come and revisit this topic along with satija lab’s new paper when they are out and published after peer review.
The framework:
In the original perturb-seq paper from 2016, the authors had identified the core challenge for profiling cells subjected to genetic perturbations; Then there existed no viable method that was high throughput and are able to do high content screens without any labour-intensive process. The experimental workflow uses pooled CRISPR screens, where guide RNAs are used to target the genes of interest. By using lentiviral infection of cells for example they are able to generate single-cell RNAseq of the infected cells, the inherent nature of the guide RNA and using a unique cell barcode and a unique molecular identifier; the researchers were able to exactly pinpoint which perturbation arise from which cell and affected which genes or a network of genes.

As one you might question, well what if there are two perturbations and how would you explain which perturbation leads to an effect? This is where using linear models and decomposing epistasis aid us in understanding the effects of perturbations.
Now with that out of the way, Let's see what the authors modified in compressed Perturb-seq. The goal of a P-seq experiment is to infer the effect sizes of the perturbations on the phenotype. Mathematically speaking, The gene expression profile can be visualized as a matrix n*m where n is the effect size of the perturbation and m is the expression level of the genes. By using the constant factor O based on sample replicates they can learn the effects of n perturbations, these scale linearly with the number of perturbations (tbh, I am slightly lost here as well since I don't have a strong math background).
They then base their hypothesis on compressed sensing theory, If the perturbation effects are sparse i.e., few perturbations affect the phenotype, perturbations tend to affect few factors that can be combined to “explain” the phenotype. They can then measure a small number of random composite samples and decompress those measurements to infer the effects of individual perturbations.
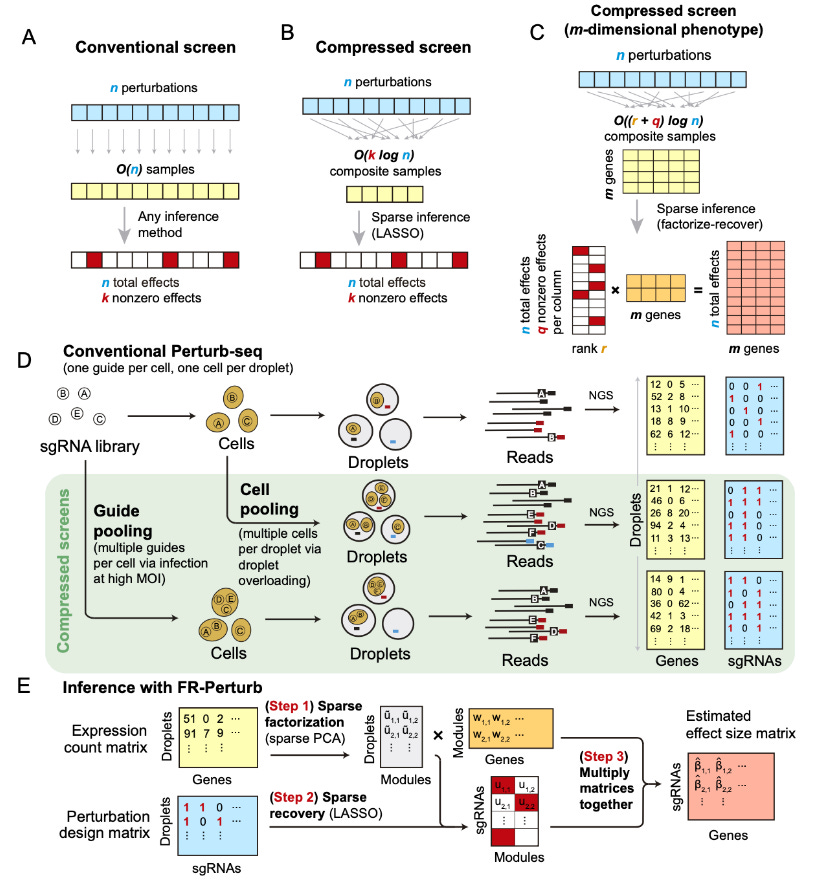
Given a single-valued phenotype, O(k log n) composite samples were obtained from n perturbations. These are enough to accurately recover enough information about the effects of the perturbations. k is the number of non-zero elements among the perturbations.
When genes do not affect the phenotype k is small than n.
The phenotype itself is an m-dimensional gene expression profile.
They use a Factorize-recover algorithm which requires O((q+r)log n) composite samples where r is the rank of the n x m perturbation effect size matrix. The rank is the number of distinct groups of co-regulated genes whose expression changes in response to any perturbation.
q is the maximum number of co-functional perturbations with nonzero effects on any individual module.
The number of required composite samples scale logarithmically or at worst sub-linearly with n, leading to much fewer required samples than the conventional approach.
Inference:
The factorize-recover algorithm:
Factorizes the expression count matrix with sparse factorization followed by sparse recovery. Sparse factorization is performed by sparse PCA and recovery by LASSO, both are often used in single-cell data.
The algorithm then computes perturbation effects on individual genes as the product of two matrices generated from the recovery step and the gene weights in each latent factor.
Okay, I understand this might be getting out as “complicated stuff” but really they are just multiplying different values generated to get a value for perturbation effects on the genes involved.
The comparison:

As in any experimental procedure proposing a new method, comparisons are a common way of convincing researchers and you that there is a use case for the proposed new method. In the case of compressed Perturb-Seq, the authors suggest the following advantages:
Increase in power of estimation of the perturbation effect
Including approaches such as cell pooling and guide pooling in combination with compressed perturb-seq leads to cost reductions over conventional P-seq.
The accuracy overall remains the same.
Guide pooling reduces the number of cells needed for screening while having increased power to detect genetic interaction effects.
FR-Perturb substantially improves out-of-sample validation accuracy over conventional gene-by-gene comparison methods.
These are the few advantages proposed by the authors, It is to be seen how effective this method is when it is implemented for performing large-scale perturbation experiments in the future.
A brief summary,
This has been a relatively long post, I if you made it till this; I thank you for your time and patience, Also, I appreciate your curiosity and applaud it. So overall, we looked into two methods which have a computational aspect for understanding perturbations. Perturbation experiments are powerful tools in a researchers tool kit, they allow us to understand processes that need to be elucidated in order to have a thorough understanding of cellular processes. Also, we use perturbations to see for example, what effect a particular drug is exhibiting in a cell line or an animal model. Scientists have been using these sorts of methods historically; One example is Patient H.M. who had severe seizures as a kid and to control these seizures they had to remove the amygdala and the hippocampus. This was a medical intervention that led to key insights to understand memory formation and retention.
We looked at two modern methods to study perturbation, These are much more begin than that HM’s intervention. But give us a better understanding on cellular regulatory processes.
I hope you had some fun reading this.
References:
Dissecting cell identity via network inference and in silico gene perturbation.
Lab socials: Morris Lab Twitter, Kenji Kamimoto

Concepts briefly explained:
A vector map of transitions is a graph that depicts the transition of a gene or protein from one state to another. It is typically used to visualize the effects of gene or protein perturbations, such as knockouts or overexpression, and can help researchers better understand the interactions between genes and proteins in the cell.
Clusterwise linear regression aims to find the partition of the data into k clusters, such that linear regressions fitted to each cluster minimise overall mean squared error on the whole data. A research paper on this is linked here. The algorithm uses a combination of data clustering and linear regression to identify patterns in gene expression data and to identify interactions among genes and proteins. By assigning each gene expression state to a cluster, the algorithm is able to identify relationships between genes and proteins, and can then be used to predict the effects of gene perturbations on gene expression. The regularization term helps to reduce the complexity of the model and improve the accuracy of the results.
scATAC-seq (single-cell Assay for Transposase-Accessible Chromatin with sequencing) is a single-cell sequencing technique used to measure the accessibility of chromatin in individual cells. This method uses transposase to cut open the chromatin of individual cells, allowing the DNA within to be sequenced. This technique is used to study gene expression and epigenetic modifications and can provide insights into gene regulation and cell identity.
Review Papers on Data Analysis:
Assessment of computational methods for analysis of single-cell ATAC-seq data.
From reads to insight: a hitchiker’s guide to ATAC-seq data analysis
Regularized linear machine-learning models are a type of machine-learning algorithm that is used to predict outcomes from a set of data. This type of model is used to make predictions about future data based on patterns found in existing data. The model uses a regularization term to reduce the complexity of the model and improve the accuracy of the results. The regularization term penalizes the model for using too many variables, thus preventing the model from overfitting the data. This helps to improve the accuracy of the model and makes it more robust and reliable. The regularization term can also be used to identify important variables that are important for predicting the outcome.
The Area under the Receiver Operating Characteristic (AUC-ROC) is a measure of how accurately a model can predict the outcome of a given data set. AUC-ROC is used to evaluate the performance of a binary classifier, such as a machine learning algorithm. The AUC-ROC measures the ability of a classifier to distinguish between two classes, by plotting the true positive rate against the false positive rate. A higher AUC-ROC score indicates that the model is more accurate at predicting the outcome of the data set. AUC-ROC is typically used to compare different models and can be used to select the best model for a given task.
Haematopoiesis is the process by which the body produces new blood cells. In mice, it is the process of generating all the different types of blood cells from a few progenitor cells. The process of haematopoiesis begins in the embryo and continues throughout the life of the mouse. It is regulated by a number of hormones and growth factors, as well as environmental cues. During haematopoiesis, progenitor cells differentiate into various types of blood cells, such as white blood cells, red blood cells, and platelets.
Myeloid progenitors are a type of stem cell that can differentiate into a variety of different blood cells. These cells can be found in the bone marrow, and they are important for the production of red blood cells, white blood cells, and platelets.
Compressed sensing is a technique used to efficiently compress and store data. It uses mathematical algorithms to reduce the number of measurements required to accurately reconstruct a signal. This technique is often used in image processing, audio and video compression, and medical imaging. In image and video processing, compressed sensing can reduce the amount of data that needs to be transmitted and stored, resulting in faster transmission times and lower storage costs. Additionally, this technique can be used to improve the quality of data by reducing noise and artefacts.
Epistasis is the phenomenon where the effect of one gene is modified by another gene. It is a type of gene-gene interaction, where the expression of one gene alters the expression of another gene.
The factorize-recover algorithm is a mathematical method used to infer the effect sizes of perturbations on a phenotype. The algorithm uses data clustering and linear regression to identify patterns in gene expression data and to identify interactions among genes and proteins. The regularization term reduces the complexity of the model and improves the accuracy of the results. By assigning each gene expression state to a cluster, the algorithm is able to identify relationships between genes and proteins, and can then be used to predict the effects of gene perturbations on gene expression. Additionally, the regularization term can be used to identify important variables that are important for predicting the outcome.