

Peering through the tissues #2
A sequencing-based approach for spatial transcriptomics and its application for discovery of novel lung cell types

The email may be truncated due to inbox size limitations, please look for the full link to see this relatively short article.

In the case of all things which have several parts and in which the totality is not, as it were, a mere heap, but the whole is something besides the parts, there is a cause; for even in bodies contact is the cause of unity in some cases, and in others viscosity or some other such quality.” - Aristotle
I often wonder and ponder a bit on this quote in the context of my daily life as a PhD student studying a complex rare disease; Idiopathic Pulmonary Fibrosis or in common terms Fibrosis of the lungs from unknown causes. At its core the lung is but merely a collection of tissue types which in turn is a collection of cell types; we have known most of the cell types in lungs through comparative studies and post-mortem tissue sampling but it still baffles me that there is a plethora of things that we do not know. As Aristotle put it slightly in a philosophical way; the lung is not a mere heap of cells similar to any complex tissue in our bodies are not just heaps of cells they exist at a particular location due to their required function and their neighbours seem to decree the fate of the cell and therefore the functional direction.
The Part 1 of the series (please read that for a better context) we looked into modern techniques that constitute the new and emerging subfield of spatial transcriptomics. Briefly, Spatial Transcriptomics entails the visualization and quantitative analysis of the transcriptome with spatial resolution in individual tissue sections; or in layman's terms, Scientists want to thinly slice tissues like Jamón ibérco and look at what cells exist in that slice and what mRNAs are expressed. The core idea is that one day this would be a much more scalable and sensitive method replacing age-old and traditional H&E staining bringing the gold standard of histology to a modern age, especially for rare tissue types.
To this end, We will look into a precursor of the widely adapted visium method of spatial transcriptomics followed by a recent resource article exploring the development of the human lung in the embryonic stages. I will try my best to explain and stick to the method implementation and dabble a bit on the data analysis tools available for the visium platform from the manufacturer’s own to a much more open access code that will empower your own workflows.
On Visualizing and analysis of gene expression in tissue sections by spatial transcriptomics.
Patrik Ståhl’s paper from 2016 was one of the pivotal papers that moulded the current-day visium platform from 10x genomics. The challenge of the day was to overcome the loss of spatial information and therefore gain insights into the positional context of gene expression which is key to understanding tissue functionality and pathological changes. Although there were some existing methods to perform spatial analysis, it was often mired with limitations such as the number of transcripts to be analyzed, reliance on pre-existing datasets for targets, and the mother of all limitations COST. To overcome this the authors leveraged and combined a few existing methods in the following manner
Immobilization of reverse-transcription oligo(dT) primers on glass slides and placed sections of adult mouse olfactory bulb (they picked this because of ample reference data).
Post permeabilization; they added reverse-transcription reagents on top of the tissue, and the nucleotides used for cDNA synthesis were fluorescently labelled which allowed them to visualize.
Post RT; the tissue was enzymatically removed, leaving the cDNA coupled to the arrayed oligos on the slide. Followed by imaging to confirm the capture of cDNA on slides.
This initial experiment was followed by scaling; ie., They deposited ~200 million oligos in each of the 1007 “features” across the capturing slide.
They followed the steps required to generate sequencing libraries.
Once they were able to obtain the data they sorted the RNA-seq data to corresponding array features using the spatial barcodes and aligned the tissue image with the features of the array. This helped them to do visualisation and consequent analysis


So, You may wonder what the advantages of performing this method are versus just direct bulk RNA sequencing.
Well, one obvious reason is the location of the transcript; for example, the authors show that they were able to identify transcripts that are usually enriched in the mitral cell layer but were not detected in the adjacent granular cell layer of the olfactory bulb.
Put into disease context, one application is to see gene expression in aggressive tumours such as neuroblastoma where samples are extremely precious. now we have a technique that preserves the morphology of the sample while performing sequencing-based assays.
Spatial transcriptomics offers an alternative approach that circumvents multiplex labelling and cell isolation.
The presence or absence of genes can be then used to define a marker profile of interest for that particular tissue area/section.
By comparing gene expression it is now possible to define intercellular marker profiles.
It can reveal unexpected heterogeneity within a biopsy which is not possible through regular transcriptome analysis and will eventually lead to much more detailed prognostic information.
Role of Bioinformatics in Spatial Sequencing data analysis.
Data analysis always plays a key role in the interpretation of the experimental data, whether its a classical molecular biology technique such as ELISA where one has to compare and contrast the fluorescence intensities of test vs controls, similarly once you get hold of the raw data it is pivotal that a series of steps are used to transform the raw data to interpretable data.
For this example let’s have a quick overview of Space Ranger; A 10x Genomics custom pipeline for analysing their Visium platform of spatial transcriptomics products. There is a short video introduction to their product below; Take a peek :)
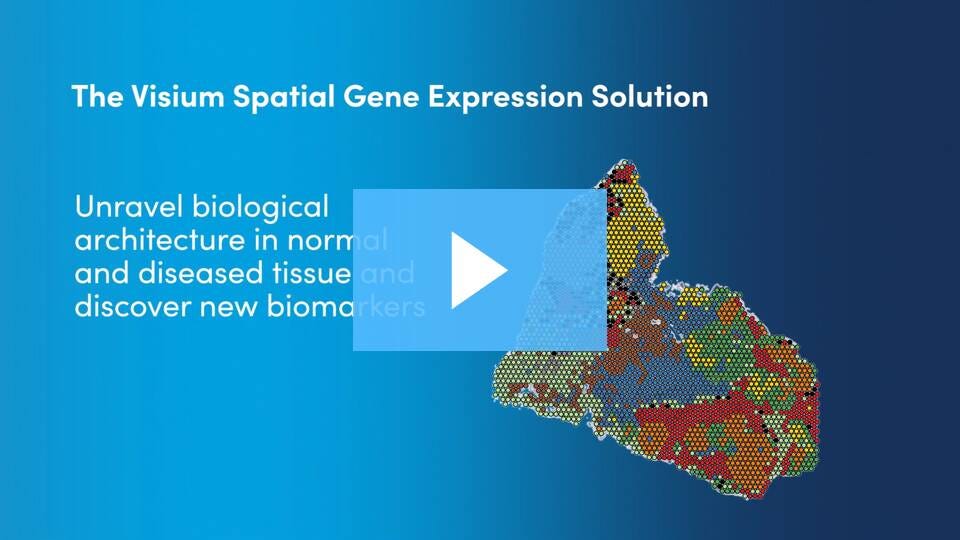
Spatial Gene Expression - 10x Genomics: A quick video of their product. Obtained from 10x Genomics website.
Overall Space Ranger is a set of analysis pipelines or a workflow that is used to process spatial gene expression data with images from microscopy. But wait, Why do we need microscopy, not direct transcription data? : It is basically because one has to use the slide image as input to be used as a map on which the gene expression measurements are visualized. Essentially, Space Ranger can combine algorithms that are required for processing the Visium slide images with gene expression analysis as well. The following are the basic commands within the pipeline with a brief description of what they do.
spaceranger mkfastq: demultiplexed the raw base calls generated by Illumina sequencers into FASTQ files
spaceranger count: takes in a microscope slide image and FASTQ files and performs alignment, detection of tissues, and Unique Molecular Identifier counting. It also generates feature-barcode matrices, determines clusters and performs gene expression analysis.
spaceranger aggr: it aids in aggregating outputs of similar samples from multiple runs and normalizes them followed by recomputation of feature-barcode matrices.
spaceranger targeted-compare: compares starting input library to Targeted Gene Expression data set, especially helpful if you are using a targetted data.
spaceranger targeted-depth: summarizes whole transcriptome analysis dataset in the context of hypothetical Targeted Gene Expression experiments.
Please refer to the software support pages on 10x Genomics for further in-depth details
Now that we have a broad understanding of the Visium platform and also have some idea of how the data is analysed let’s look at a very recent article by Alexandros Sountoulidis and co-authors from the Scilifelab which is probably the cradle of really exciting spatial transcriptomics research. Keep in mind that I will only dwell a bit on their use of the technique as they have complemented visium with other spatial seq techniques.
A topographic atlas defines developmental origins of cell heterogeneity in human embryonic lung.
When I read the book: When Breath Becomes Air by Paul Kalanithi1; a harrowing and yet inspiring tale of a neurosurgeon who later succumbed to lung cancer. I had to intermittently stop to think of the biological complexity of the organ and its simple function as a gas exchange medium that has enabled us and all the land-dwelling animals to evolve and survive on the surface.
As a student who is working on IPF, I know there exists such a diversity of cell types that contribute towards the function of this organ. The COVID-19 pandemic as well has brought back into attention how the immune system aggressively defends this organ and the subterfuge of the ACE2+ cells present in the organ by the virus puts us at extensive risk of death bringing us all to a halt in attempts to survive. But as a curious reader you might ask, wait how many types of cells exist within the organ? To address this Alexandros and colleagues leveraged modern sequencing techniques such as the spatial transcriptomics platform visium we discussed above in embryonic lung.
The simple answer, We knew there are at least 58 distinct cell types/identities till now. But, by using high-resolution techniques such as spatial seq they were able to distinguish 83 cell types/identities across six main categories: Mesenchymal, epithelial, endothelial, neuronal, erythroblasts, and immune cells. To achieve this,
They dissected lungs from 17 embryos ranging from 5 weeks post-conception to 14 weeks post-conception.
The right lobes were used for scRNA-seq and the left lobes for spatial analysis.
They used the gene expression patterns on the tissue sections with spatial transcriptomics at nine different stages of development.
From the key observations in their data; Mesenchymal cells was the largest cluster of cells to exist. Subclustering revealed 6 distinct cell types, along with several immature cell states. These immature cell types were further characterised using spatial techniques as mesothelial cells, pericytes, chondroblasts, and airway smooth muscles to name a few. This stresses the importance of spatial transcriptomics in detecting transitionary states at such an early time point.
Furthermore, They show that Airway smooth muscles originate from the immature mesenchyme. Proliferating ASM cells showed high expression of smooth muscle markers and they also show some transcription factors such as DACH2 are detected in intermediate states.
Spatial analysis aided them to localize the clusters by complementing with trajectory analysis in distinct positions along the developing airways.
It appears that fibroblasts follow two differentiation trajectories. The embryonic fibroblasts have distinct role to provide the scaffolding for resident lung cells.
They also use really cool methods to understand cell-cell interactions and communications.

Before this letter exceeds your “coffee becoming cold time”, I will cut it short and continue a deep dive into this paper at a later point. There I shall break down the details and pick up the gems that the authors have described in the resource paper(link to the article in references). But thank you so much if you have reached till here, please drop a comment below and say Hi
So probably Aristotle was right, There is a purpose for these heaps of cells to exist in a very particular fashion their contacts are important for their development. They need signals from their neighbours so that they can move and relocate to develop in a particular fashion and thereby making the organism as a whole exist.
References
Oh, If by you gained some insights and would like to help me be caffeinated to write the posts please scan the QR below or click here :)

This is an amazon book link if you are interested in purchasing and giving it a read. I receive a small kickback if you go through with the purchase at no additional cost to you.