

Unlocking New Possibilities in Single-Cell Spatial Biology with CytoSPACE Method
A new tool for spatial transcriptomics.

Dear Community,
This week’s post will likely be rather short. We will check out one cool method that integrates scRNA-seq and Spatial Transcriptomics data to recover spatial contexts of different cells and look over briefly on its advantage.
As always, not to sound like a broken tape… The following helps me a lot and would not take any significant time from you and will also help us gather some experts.
Ask your colleagues or friends who are interested in these topics to subscribe.
Tweet and share the post on your social media platforms like LinkedIn or Twitter.
Participate in the subscriber chat. You will find the buttons to do this along the way.
Let’s get started.

The past few years in molecular biology and bioinformatics have pushed the frontiers of our knowledge. The introduction of high-throughput next-generation sequencing coupled with the ability to efficiently isolate single cells to perform single-cell sequencing has resulted in large-scale organ-specific atlases. The most popular of these attempts has resulted in the Human Cell Atlas from the Chan-Zuckerberg Initiative also called the Tabula Sapiens dataset.
As a progression to our knowledge that tissues are often heterogenous constructs consisting of various cell types and knowing the location functions of cells often can lead us to glean new insights. These insights with a trained eye and critical understanding of cellular functions might lead us to new avenues in addressing complex diseases such as cancer.
It would not be a far-off speculation that a large-scale attempt to learn the spatial genomic, epi-genomic, transcriptomic, and proteomic atlases of animals such as Zebrafish, mice and humans will be presented from various working groups across the world. These atlases will likely inform and push the field in a direction to understand the “Wholistic” nature of tissues.
For such atlases to exist, there needs to be a plethora of tools and toolkits for analysing the data and integrating them with existing methods. In fact, it is in my personal opinion that for any method to be successfully adopted there needs to be a software suite or tool kit that can be used by biologists with relative ease. One example, in my personal experience, is Seurat, which is a suite of tools that is relatively easy to analyse single-cell datasets.
With an increasing pivot from the industry to provide methods for spatial biology, it is clear that there will be a vast range of tools that are in the making for the analysis of spatial datasets. We have discussed a few of them in previous posts here. On a similar thread, I would like to introduce you to another new exciting addition to your potential software tool kit.
High-resolution alignment of single-cell and spatial transcriptomics with CytoSPACE.
This recently published tool is an efficient computational approach for mapping individual cells from a reference scRNA-seq (mRNA expression profile for single cells) to a spatial transcriptomics assay. To those who are new to spatial transcriptomics, simply put, this is a new method to pinpoint the locations of the cells and what mRNA and eventually proteins are being expressed; I have written in detail in the multipart series.
The core idea of this tool is the formulation of single-cell/spot assignment as a convex optimization problem; whose basic idea is to find the point in the feasible region (say ST slide) where the objective function has the minimum value (the location of a single cell). These are often used in machine learning techniques such as gradient descent. CytoSPACE also uses the Jonker-Volgenant algorithm which is a graph optimization algorithm that solves the convex optimizations through weight-matching bipartite graphs, these are related solutions or iterations to the famous travelling salesman problem.
So what does this tool claim to do you may ask;
There are few major claims versus the tools that already exist. Key claims are listed below:
The approach guarantees an optimal mapping result while exhibiting improved noise tolerance
Output is a reconstructed tissue specimen with both high gene coverage and spatially resolved scRNA-seq data suitable for downstream analysis.
Can be used in the discovery of context-dependent cell states.
CytoSPACE is a robust tool and has the potential to deliver improved spatial mapping of scRNA-seq data
There have been tools that tried to address some of the issues we face when given a reference dataset in the form of scRNA-seq to map it onto a Spatial transcriptomics tissue section. Most of them were limited by some of the shortcomings listed below.
Most commonly used platforms such as 10x visium are limited to bulk gene expression measurements
The spatially resolved expression profile is derived from several cells due to the spot size limitations and overlap of the cells on the slides.
Computational methods for resolving have been using scRNA-seq data to deconvolve ST spots to matrix of cell type proportions
If there is no scRNA-seq the transfer of cell states in ST is difficult
At a very broad level, CytoSPACE relies on two inputs;
Spatial transcriptomics data of a tissue section profiled through one of many commercially available platforms such as nanostring, 10x genomics etc.,
a single-cell RNA sequencing data set of the matched tissue. So if you are working with tumours of the lung, you will need a lung scRNA-seq and a lung ST-seq.
The gears behind the machine:
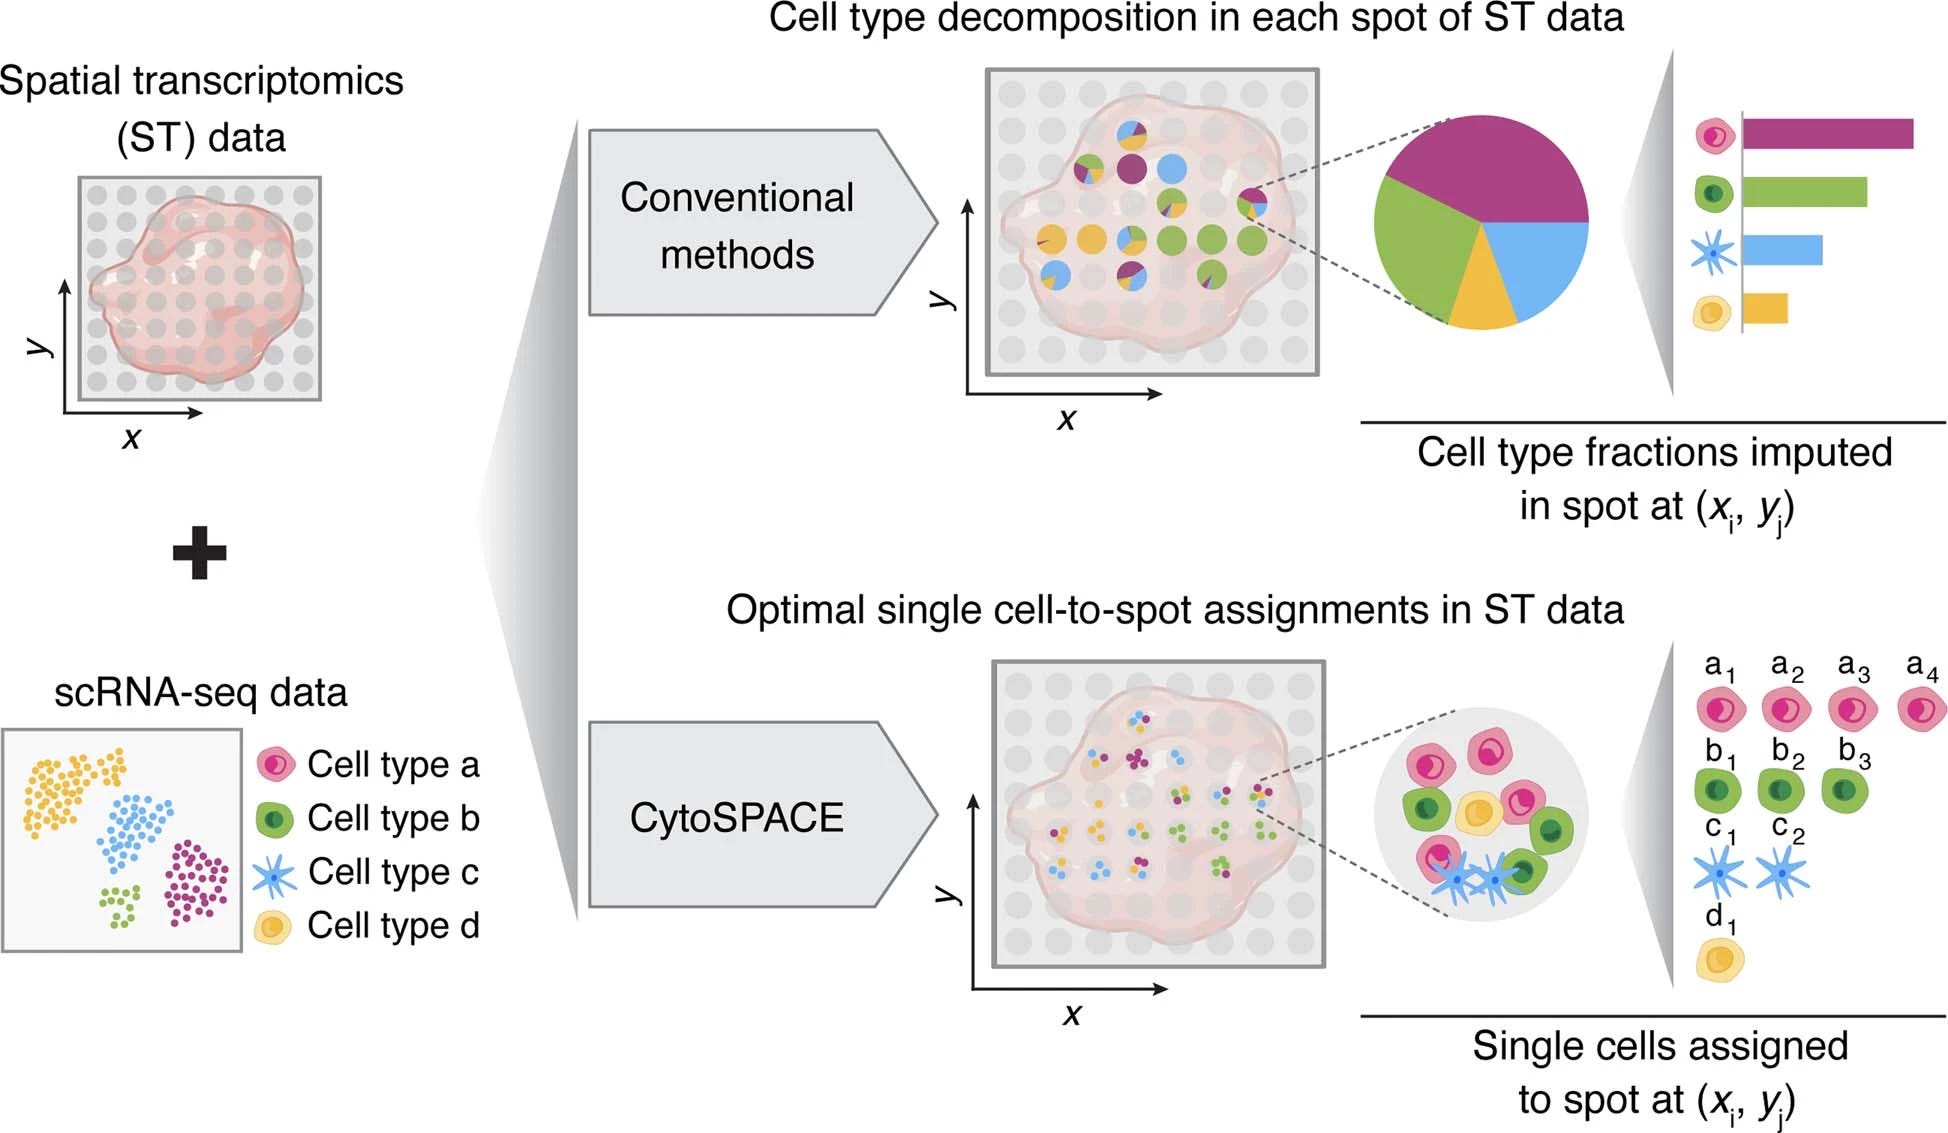
The computational framework of CytoSPACE is surprisingly simple broken down into four main steps here and as well as in the figure from the paper:
Estimate cell type fractions in ST data
Estimate the number of cells per ST spot
Take a sample of scRNA-seq data and match the estimated number of cells per cell type
Assign single cells to the ST spots using the shortest augmenting path optimization

If you are keen on understanding the mathematical equations such as the cost function used to optimize the framework, I would highly recommend giving a read through the paper where the authors have provided the details.
Validation and benchmarking
Any new tool proposed requires a strong argument for its existence and what advantages it would provide. So, validation and benchmarking steps are crucial to compare the performance metrics against previous methods and propose to the readers why we should use the tool provided and give an overview of the computational requirements.
For Validation, the authors use Slide-seq data from Cerebellum and hippocampus
Each bead of Slide-seq was replaced with the most correlated single-cell expression of the same cell type derived from a scRNA-seq atlas.
Superimposition of spatial grid ie., on the scSEQ data they gridded them to resemble ST and this gives pseudo-bulk transcriptomes with a mean of 5/15/30 cells per spot
Creation of paired scRNA-seq atlas from the cells underlying pseudo-bulk transcriptomes
Addition of noise to emulate technical and platform-specific variation.

The benchmarking was performed with existing tools and the following is a slightly abridged overview :
CytoSPACE was benchmarked against 12 previous methods including Tangram (it also integrates data) and CellTrek (uses spatial Seurat for shared embeddings).
It was also benchmarked against approaches like Pearson correlation and Euclidean distance.
Output Comparision: Assigning each cell to a spot with the highest score or the closest euclidean distance (only for CellTrek)
CytoSPACE has higher precision for mapping single cells to their known locations in simulated ST datasets
The precision holds well for multiple spatial resolutions independent of which part of the brain it is from
Assessment of robustness: Does the result vary based on the input parameters i.e, Step1 to step 3
They simulated an ST dataset and estimated cell type abundance and found there is no significant correlation with mapping precision.
by systematically perturbing the types of cells (cell type abundance) and number of cells per spot in the ST data.
They find that CytoSPACE outperforms previous methods
They tested for output stability when sampling the scRNA-seq data set with different seeds and when using different distance metrics to calculate cost function checking what the cost function
Results are consistent.

Additionally, There is always the need to use these in a real-world dataset. The above involved a dataset that was synthetically generated, and altered to test the parameters if they perform well etc., By utilizing the datasets from previously published studies and comparing them versus currently available methods the authors overall show the effectiveness of the tool kit. The following is an abridged version of their findings.
The alignments from CytoSPACE were compared to Tangram and Cell-Trek.
CytoSPACE can process the visum data within 5 minutes on a single-core CPU. Ideally would run on any modern laptop for a small sample without major bottlenecks.
For identifying cell states with respect to where they are located in the tissue microenvironment
They assigned two groups based on proximity to the tumour cells for each cell type.
Using T cell exhaustion as a "marker" i.e, these cells enter the tumour microenvironment and lose the ability to kill the cells and are present there. CytoSPACE was able to enrich these cells in all the scRNA-seq and ST dataset combinations versus Tangram and CellTrek.
Using an ecotype (a cellularly defined ecosystem of sorts in cancers such as melanoma) consisting of cells such as B cells, Plasma cells, T cells and macrophages with the known location they demonstrate spatially biased cell states.
CytoSPACE successfully recovers the spatial biases across lymphoid and myeloid lineages
Using CytoSPACE they also demonstrate localization patterns of TREM2+ and FOLR2+ macrophages which are known to localize to the tumour stroma and the tumour mass respectively.
CytoSPACE can capture these findings with higher statistical significance. -Two additional uses of CytoSPACE :
Can CytoSPACE capture known patterns of the spatial organization? For this, they used a normal kidney dataset from mice which is well annotated.
CytoSPACE was able to reconstruct zonal regions, identified cell types that colocalized to the glomerulus and arranged nearly 30 epithelial states in spots known to be consisting of epithelial cells
Overall this outperforms previous methods.
Can CytoSPACE enhance single-cell spatial transcriptomics with low gene throughput such as MERSCOPE?
They confirm that CytoSPACE can accurately map single cells profiled with MERSCOPE and summarize the spatial contexts
They claim that CytoSPACE is able to reconstruct complex tissues at a single-cell level
Reference:
Vahid, M.R., Brown, E.L., Steen, C.B. et al. High-resolution alignment of single-cell and spatial transcriptomes with CytoSPACE. Nat Biotechnol (2023). https://doi.org/10.1038/s41587-023-01697-9
Lab socials: Newmann Lab twitter
A tweet-torial by Aaron Newman: thread
Disclaimer:
I am not an expert in this field so if there are errors please contact me so I can correct them ASAP.
If you enjoyed the article, Please leave a like and comment below. And if you appreciate the work, maybe scan the QR code and buy me a coffee.
See you next week with a cool new paper, we will likely visit epigenetics x spatial transcriptomics.
