

Peering through the tissues #6: The next frontier
Ex nucleo est vita: Slide-tags a newly proposed method for spatial profiling of the nucleus

Dear Members of the community,
I hope you are having a well-deserved easter break, I am going to keep this short for the sake that you can enjoy the time with your family and loved ones. It has been a thoroughly enjoyable experience reading the paper that I try to summarize today. It is exciting to see that spatial transcriptomics as a sub-field of biology becoming more mature and the availability of various profiling methods vast. As I see now, several of these methods would not gain mass adoption. But, nonetheless, it is vital for us to understand as many of the methods as possible because at some point as researchers and individuals you might be able to apply the concepts to your projects that might have a profound impact. So let us go on a journey together towards achieving creativity and Here is a quote on it.
“Creativity is inventing, experimenting, growing, taking risks, breaking rules, making mistakes, and having fun.” - Mary Lou Cook
As always, take action to subscribe now. Hit that button and share it with your friends and colleagues. Leave a comment as it helps with the algorithms :)
Slide-tags: scalable, single-nucleus barcoding for multi-modal spatial genomics
Imagine this, you are a researcher with a driven curiosity and urge to understand complex cellular interactions. You are given the challenge to extract the most relevant transcriptional profile in your study. The relevant information pertains to mRNAs that are actively produced within the nucleus before it gets processed and translated into the protein it was meant to be. How would you apply a combination of existing methods to achieve a spatial profile of the tissue?
The observational history of the nucleus dates back to the early depictions of its existence by Antoine van Leeuwenhoek. It was further refined by people like Franz Bauer, Robert Brown and Matthias Schleiden. So, the study of the nucleus is as old as the study of the cellular components and it was the first cellular organelle to be described and yet we still have a long way to go before we gain all the granular insights into its functions and its interactions.
The current study is a fascinating application of single-nucleus sequencing applied to a spatial context. The authors have developed how single nuclei within an intact tissue section are tagged with spatial barcode oligos derived from DNA-barcoded beads with known positions. The tagged nuclei can be then used as an input for single-nucleus profiling assays, this in turn tries to address the cytoarchitectural organisation of cells being profiled.
The current study is a pre-print and has not been through peer-review. We will visit it at a later time point after it is published again to see how reviewer comments can be helpful.
Performing Slide-Tags on tissues.
The method described is simple, elegant and straightforward. The key idea relies on specially constructed 10uM beads that contain a photocleavable longer sequence and a spatial bead barcode for the positional information and the usual Unique molecular identifiers.
DNAs or RNAs from tissues are captured and spatially barcoded by arrays of densely packed spatially indexed arrays of DNA barcoded 10uM beads.
They use photocleave and diffuse strategy to the spatial barcodes into 20uM fresh frozen tissue sections to associate them with nuclei.
Isolated nuclei then can be processed through a microfluidic capture device.
This method is particularly advantageous with several bead-based scSEQ platforms

Resolving single-nucleus RNA sequencing of mouse brain
Slide-tags were performed followed by droplet-based snRNA-seq on a coronal section of the adult mouse hippocampus.
The protocol involves dissociating and sequencing 1661 nuclei from a 3mm2 tissue section and clustering using a standard single-cell pipeline.
Annotation of clusters using cell class markers.
Multiple barcodes can be picked up for one cell allowing for higher assignment confidence.
DBSCAN was used to separate background noise from signal
Nuclei are assigned spatial coordinates by using UMI-weighted centroid of DBSCAN clustered spatial barcodes.
Assigned spatial locations to 839 high-quality nuclei
Using a Nissl-stained serial section and slide-tags, they found the slide-tags features in the hippocampal subfield CA1 congruent with the Nissl image.
Quantification of standard error for each centroid in the x and y axis
nuclei misalignment rate calculation nu leveraging the structure of CA1 and Dentate gyrus
Validated if the tagging procedure affects the quality of the snRNA-seq data on adjacent sections and found there is no major variation introduced by slide tags

Slide-tags for identifying layer-specific gene expression across cell types
The human cerebral cortex is well-studied and the cytoarchitecture has been well-characterized. It is organized into discrete layers with specific subpopulations of neurons. The current methods can resolve these distinct layers based on broad patterns of varying gene expression. But they are still limited in identifying the varying genes to specific cell types in the spatial context.
Can slide-Tags be used for profiling transcriptome especially cell-type-specific spatial gene expression?
the authors profiled the 28.3mm2 region of the human prefrontal cortex.
They were able to recover 4067 spatially mapped nuclei and recapture known cell types via clustering and their distributions across spatial structures were conserved with the protocol.
Using computational integration methods, they could annotate various cell types such as Astrocytes, Endothelial cells, and Glial cells, to name a few.
Astrocytes (star-shaped nerve cells) formed two clusters segregated between white and grey matter regions.
By using this method the authors were able to identify the layer-specific neurons. Consequently, they show that genes can exhibit spatially variable expression.
Using the whole-transcriptome spatially resolved snRNA-seq profiles they systematically plotted layer distributions of the highest spatially varying genes for excitatory neurons and Astrocytes.

Slide-tags can be used for receptor-ligand prediction
Proper segmentation of densely packed tissues is a challenge, especially in immune tissues
Since segmentation of the nuclei is accomplished automatically, can Slide-tags be used in complex tissues?
Performed Slide-tags snRNA-seq on human tonsil
Recovered 81K nuclei from a 7mm2 tissue
Sequenced 8747 nuclei and mapped 5778 nuclei.
clustering revealed B and T cell zones. Germinal Center B cells in the germinal centre, T follicular helper cells and follicular dendritic cells.
Similarly, they were able to distinguish the dark zone and the light zone using gene markers that are specific to these zones. This was based on the variance of gene expression.
They found that T follicular helper cells were enriched in light zones while follicular dendritic cells were dispersed between the light and dark zone
Using putative receptor-ligand interactions in spatially agnostic marker with LIANA(LIgand-receptor ANalysis frAmework) they were able to perform a spatial permutation test to identify the interactions that significantly co-occur.
They predicted that CD40 and CD40LG interaction within the GCBs and T follicular helper cells and eventually identified that as well as downstream targets of canonical receptor-ligand interactions such as TRAF3
Slide-tags enable spatial contextualization of cell-type specific receptor-ligand interactions that are not obvious by analysis of gene expression alone.


Slide-tags enable multimodal spatial investigation of metastatic melanoma clones.
As we saw in an earlier article, the epigenome provides another layer of information that is crucial to understanding disease pathology. Concurrent measurement of Genome, epigenome and transcriptome is sort of the holy trinity in understanding the disease.
In the context of spatial mapping of these cells and their "states/fates" are essential for giving us an almost complete picture of the cell types present and location etc.,
They leveraged the tumour heterogeneity present in melanoma samples to measure the spatial transcriptome and epigenome.
They recovered 10960 nuclei after dissociation of which 6464 nuclei were sequenced and 4804 profiles were used. ( this was the snRNA-seq )
In an adjacent section, they applied a multiome approach where they tagged the nuclei and performed droplet-based combinatorial snATAC and snRNA-seq.
They mapped 2529 nuclei from a 38.3mm2 section.
Unsupervised snRNA-seq and multiome data clustering identified immune, stromal, and tumour cell types.
Tumour cells were split into two subpopulations and denoted as tumour cluster1 (TC1) and Tumour cluster2 (TC2).
They used inferCNV a popular scRNA-seq tool to identify changes in gene copy numbers in their data.
They observe inferred genomic differences with spatial and transcriptional separation in TC1 and TC2.
They also checked for T-cell infiltration. T-cells have alpha and beta clonotypes based on their T-cell receptor sequences.
TCR beta was significantly expanded in TC2 vs TC1 along with CD8 T cells
TC2 had upregulated cytotoxic GZMB expression.
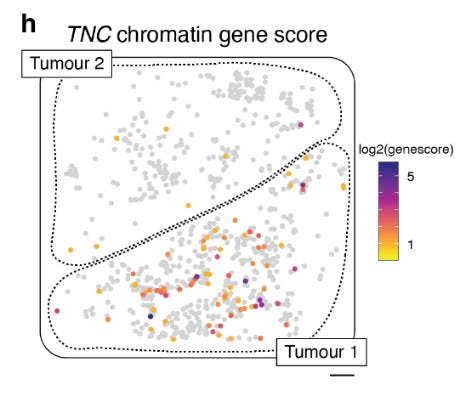
Using the snATAC data they identified TNC as a candidate gene. that is differentially expressed and differentially accessible for the cellular transcriptional machinery in TC1.
TNC has been previously associated with a mesenchymal-like cell state.
TC1 is more mesenchymal-like and TC2 is more melanocytic cells.
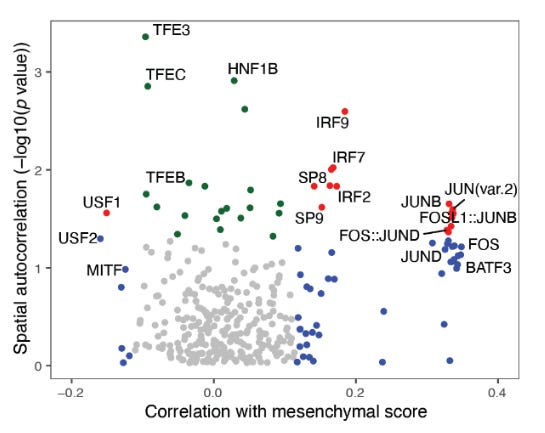
Using ChromVar a tool to correlate the known transcription factors in these two cell types. They identified that top spatially autocorrelated TF motifs associated with mesenchymal-like states were JUN, FOS and IRF, family members. This does two things, confirms and aligns with the previous findings and, It suggests that epigenomic signatures are locally clustered.
This gives us the idea that the inheritance of epigenetically reprogrammed states in cell division or local signalling environments

Data and code availability:
Code for processing the spatial positioning pipeline: https://github.com/broadchenf/Slide-tags
Data is available at the Broad Institute Single Cell Portal: https://singlecell.broadinstitute.org/single_cell
Conclusions
I am going to avoid any strong conclusions/opinions here since it is at the pre-print stage. But the ability to perform spatial profiling with a single-cell approach is really essential to the field as several current methods rely on reference data and deconvolution tools to achieve what I can call a pseudo-single-cell resolution. I feel that Slide-tags can be a crucial component or even a platform for further development of spatial biology tools.
References:
Lab Socials:
If you enjoyed the article, Please leave a like and comment below. And if you appreciate the work, maybe scan the QR code and buy me a coffee.
See you next week with a cool new paper may be an analysis method for computational biology.
