

When & Where Genes Whisper: Unlocking Real-Time Transcription with scGRO-seq and SPACECAT
Two molecular methods converge to decode the choreography of gene expression at single-cell resolution.

Dear Community,
When I was taught basic biochemistry more than 15 years ago (that’s how long I've been on this journey of biology). Often, we thought or were taught that the linear nature of transcriptional and post-transcriptional events was the case. It might have been the basic bias of the textbooks we used or simply the educator's lack of alacrity in conveying the complexity of cellular architecture. And yet, even to this day, we are presented with several profound questions. Assuming that the genetic blueprint is more or less the same within a single organism, the flow of information, ie from DNA to RNA to Protein, often seems to be straightforward as postulated by the central dogma. But the dogma for my reasoning lacks some crucial “branching points”. The branching points I reason to myself are the location of the cell in context and when a gene, such as X, is activated or silenced. The contextual understanding of these fundamental questions was somehow omitted from my studies until a later point in time. The simplistic, reductionist view I had earlier recognised is now a monumental folly in studying biology. A contextual understanding of various tissues and classes of cells within those tissues dictates gene expression and informs any potential therapeutic developments in the case of diseases.
The advent of single-cell RNA sequencing and the broad commercialisation of these methods represented a monumental leap forward in dissecting cellular heterogeneity at higher resolution. The state of the art had moved one step deeper, so to speak, from bulk-aggregated tissue RNA sequencing to isolated single-cell gene expression analysis. The moment these technologies truly reached an inflexion point was the advent of whole-organ atlases, driven by abundant funding concentrated at a few select institutions. Although these atlases are far from perfect in capturing the diversity of the effects of genetic variations on cell functions (in this case, meaning polymorphisms that make us unique), they laid the groundwork for a modern understanding of cellular heterogeneity in a post-histological age.
However, the widely available current methods should not be considered the gold standard, as it has been shown time and again that our perception of what the gold standard is keeps changing. Here, I would like to highlight the well-known blind spot: standard scRNA-seq protocols often measure the steady-state abundance of mature, polyadenylated messenger RNA. This is not a snapshot of real-time gene expression, but rather an accumulation—a time-averaged signal that is confounded by the complex and highly regulated kinetics of RNA processing and degradation. Consequently, it is often insufficient to infer the actual, instantaneous transcriptional activity of a gene. Furthermore, the sample preparation process associated with scRNA-seq, which involves dissociating tissue or cells from cell culture into a single-cell suspension, removes the crucial spatial information that can define the cell's role in the niche. The latter is now being addressed by spatial RNA sequencing with several commercially available methodologies discussed in earlier posts.

In this deep dive, we will review two recent “specialised” sequencing methods published from the laboratories of Philip A. Sharp (1993 Nobel laureate for identifying splicing mechanisms) and Alex K. Shalek, who offer elegant and complementary solutions to the two challenges briefly touched on above.
The first, "Single-cell nascent RNA sequencing unveils coordinated global transcription" by Mahat et al., introduces scGRO-seq. This method provides a high-resolution snapshot of the "when" by capturing newly synthesised, nascent RNA transcripts in individual cells. The second, "Live cell tagging, tracking and isolation for spatial transcriptomics using photoactivatable cell dyes" by Genshaft et al., presents SPACECAT, a technique that addresses the "where" by using light to tag live cells based on their spatial location, permitting their subsequent isolation and analysis while preserving their positional identity.
The common denominator in these papers is the use of precision chemistry in conjunction with molecular biology to achieve levels of measurement and control that were previously unattainable. Both scGRO-seq and SPACECAT pivot away from purely enzymatic, biological reactions that are often used, and instead employ a bespoke chemical tool that is at the core of their innovation. For scGRO-seq, it is the bio-orthogonal efficiency of copper-catalysed "click" chemistry that enables the capture of scarce nascent transcripts. For SPACECAT, it is the spatiotemporal control afforded by a light-removable "photocage" that allows for the precise labelling of live cells. This convergence demands a more interdisciplinary perspective, one that appreciates not only the biological implications but also the nuances of reaction kinetics, phototoxicity, and chemical orthogonality.
A brief primer on foundational methods and principles.
In this section, we will attempt to address some of the core principles underlying scGRO-seq and SPACECAT. Often, due to space constraints imposed by journals, the core foundational reasoning is condensed into a few sentences, assuming that everyone reading the paper is an expert and familiar with the labyrinth of foundational studies conducted over the past several decades. Let's break down a few key points before we delve into the research papers themselves.
The Lineage of Nuclear Run-on Assays
As discussed above, generally RNA-seq provides an accumulated snapshot of a cell, akin to long exposure photography (which I was a practitioner of for a brief time) the abundance measured by RNA-seq methods is a net result of its synthesis, splicing, export and degradation which in turn can obscure the actual underlying transcriptional activity. To address the challenges of which genes or gene sets are being actively transcribed, researchers developed the nuclear run-on assays.
Conceptually, a nuclear run-on assay is similar to stop-motion photography, where an actively transcribing RNA polymerase enzyme is provided with a pulse of labelled “ink” akin to a pulse of flashes used in stop-motion photography to capture the scene. In this method, cells are gently lysed to isolate their nuclei, which are then flash-frozen to halt transcription. The nuclei are subsequently thawed in the presence of labelled nucleotide triphosphates (NTPs). The already-engaged RNA polymerases resume transcription for a short period, incorporating the labelled nucleotides into the nascent RNA chains they are actively synthesising. This process effectively "tags" the 3' end of the nascent transcript at the precise location of the polymerase, providing a high-fidelity map of transcriptional activity across the genome.
This foundational technique has evolved significantly over the years:
Global Run-On Sequencing (GRO-seq): Developed in 2008, GRO-seq was the first method to apply the run-on principle on a genome-wide scale using next-generation sequencing. It typically uses a bromouridine triphosphate (Br-UTP) analogue for labelling. While revolutionary for its ability to map enhancers and promoter-proximal pausing, GRO-seq provides resolution on the order of tens to hundreds of base pairs, and its protocols can be technically demanding.
Precision Nuclear Run-On Sequencing (PRO-seq): Introduced as a refinement of GRO-seq, PRO-seq utilises biotin-labelled NTPs in a run-on reaction that is designed to halt the polymerase after the incorporation of a single labelled nucleotide. This crucial modification, coupled with enrichment for biotinylated RNAs, enables the mapping of polymerase active sites with single-base-pair resolution. This precision is invaluable for studying the fine-scale dynamics of transcription, such as the exact positions of paused polymerases at promoters.
Click, Capture, Code: The Chemistry That Enables scGRO-seq
The challenge for scGRO-seq was to attach a unique barcode to an infinitesimally small quantity of nascent RNA within the molecular milieu of a single nucleus, whilst avoiding purification steps to reduce sample loss. Unlike traditional enzymatic ligation methods, which are “not efficient enough”, Click Chemistry uses a class of modular chemical reactions that use small building blocks to put together a larger molecule. Imagine Lego blocks or a classical Ravensburger puzzle, which works by clicking in pieces that can construct and make large assemblies. Described by K.B. Shapless its’s one of the core tenets of scGRO-seq.
The Copper(I)-Catalysed Azide-Alkyne Cycloaddition (CuAAC). The underlying reaction, a 1,3-dipolar cycloaddition between an azide and an alkyne, was known for decades but was slow and produced a mixture of products. The breakthrough was the discovery that a copper(I) catalyst accelerates the reaction by a factor of up to 8 orders of magnitude and, crucially, renders it highly specific (regiospecific), yielding only a single product: a stable 1,4-disubstituted 1,2,3-triazole ring.
An effective analogy is to imagine the azide and alkyne functional groups as two unique, interlocking puzzle pieces. In the complex environment of the cell, they are bio-orthogonal—they interact only with their intended targets and will not react with native biological functional groups. The copper(I) ion acts as a "matchmaker" or template, bringing the two pieces together and orienting them perfectly, allowing them to "click" into place with near-perfect efficiency. It is this combination of speed, specificity, and biocompatibility that makes CuAAC an exceptionally powerful tool for covalently linking molecules, such as a propargyl-labelled nascent RNA and an azide-labelled DNA barcode, in a biological setting.
Light as a Scalpel: How SPACECAT Tags Cells with Precision
In the case of SPACECAT, a core challenge was the controlled labelling of cells. In an effort to label only specific cells in a user-defined region of a live tissue while leaving the neighbours untouched. Photocaging is a method in which a molecule’s activity is temporarily blocked by a chemical moiety which can be removed on demand with light. In the case of SPACECAT, the scientists employ nitroveratryloxycarbonyl (NVOC) group, a member of the widely used nitrobenzyl family of PPGs. The key feature of the NVOC group is its photolability; it is stable under normal biological conditions but is rapidly cleaved upon exposure to a specific wavelength of light, typically in the near-UV range (350-405 nm).
The cleavage mechanism for these nitrobenzyl-based PPGs is a well-characterised photochemical process known as a Norrish Type II reaction. A useful analogy is to think of the NVOC group as a locked cage and the UV photon as the key. When the photon is absorbed by the nitro group of the cage, it triggers a rapid internal electronic rearrangement. This excited state leads to the abstraction of a hydrogen atom from a nearby carbon, initiating a cascade of bond-breaking and bond-forming events that culminates in the cleavage of the covalent bond holding the cage to the molecule of interest (in this case, the calcein dye). This uncaging process is extremely fast—occurring on the nanosecond to microsecond timescale—and happens only where the light is shone, providing exquisite spatiotemporal control over the activation of the caged molecule.
Genes Don’t Whisper—They Burst: Decoding Transcriptional Noise at Single-Cell Scale
Early models of gene expression often depict the system as a steady, continuous process, typically in response to upstream stimuli. The nature of these stimuli was often classified into “containers” based on the observed function, i.e., the mechanical movement of the cell towards a source of nutrients in the case of phagocytosis, and most functions of genes that regulate are still grouped together in ontological terms, often used to understand processes.
However, in reality, transcription occurs in sporadic or pulsatile bursts. In a recent study by Dan Lu, it was demonstrated that post-DNA damage p53 is activated in a pulsatile (episodic) manner, meaning its levels rise and fall in repeated pulses rather than remaining constantly elevated. These pulses of p53 lead to time-separated waves of gene expression for its target genes. Importantly, the posttranslational modification state of p53—specifically, acetylation at K373 and K382—differs between the first and second pulses, which in turn affects which target genes are activated during each pulse. As a result, different sets of p53 target genes are expressed at different times, allowing the cell to temporally organise multiple processes in response to DNA damage. This is often termed as transcriptional bursting, it is also a fundamental source of the non-genetic, cell-to-cell variability observed in populations of identical cells.
The formalisation and quantification of this behaviour in the field widely employs the random telegraph model (The scope of which might be discussed at a later point, but not for this essay). Essentialy this is a mathematical framework that models a gene’s promoter as stochastically switching between two states: an active “ON““state, where in RNA polymerase can initaite transcription and an inactive “OFF” state where it cannot. The key kinetic parameters of this model are the Burst Size and Burst Frequency.
Burst Size (k_m/k_off): This represents the average number of mRNA molecules produced during a single continuous "ON" period. It is conceptually related to the rate of polymerase initiation (k_m) and the rate of switching to the OFF state (k_off). Studies suggest that burst size is often regulated by core promoter elements.
Burst Frequency (k_on): This represents how often the gene switches from the OFF state to the ON state. It is frequently regulated by distal elements, such as enhancers, which can influence the probability of promoter activation.
The Genome’s Remote Controls: Enhancers and Super-Enhancers
Gene regulation in eukaryotes is not solely dictated by the promoter region immediately upstream of a gene. A vast and complex network of distal regulatory elements, known as enhancers, plays a critical role. Enhancers are short regions of DNA that can be located tens or even hundreds of kilobases away from their target genes. They function by binding specific transcription factors, which then recruit co-activators and the Mediator complex. This assembly is thought to physically loop through three-dimensional nuclear space to make contact with the promoter of a target gene, thereby increasing its transcription rate.
Active enhancers have several key hallmarks. Their flanking nucleosomes are typically marked by specific histone modifications, namely monomethylation of histone H3 at lysine 4 (H3K4me1) and acetylation of H3 at lysine 27 (H3K27ac). Furthermore, active enhancers are themselves transcribed by RNA Polymerase II, producing short, unstable, non-coding transcripts known as enhancer RNAs (eRNAs). While the precise function of eRNAs is still an area of active research, their presence is a reliable indicator of enhancer activity.
In recent years, a special class of regulatory regions termed super-enhancers has been identified. These are not single enhancers but large clusters of individual enhancers, spanning tens of kilobases, that are densely occupied by master transcription factors and the Mediator complex. Super-enhancers are believed to drive the robust expression of key genes that define a cell's identity and are frequently implicated in developmental processes and diseases, such as cancer. Because methods like GRO-seq and its derivatives can detect the transient eRNAs produced from these elements, they are exceptionally powerful tools for identifying and quantifying the activity of both typical and super-enhancers across the genome.
Part 1: scGRO-seq – A Single-Cell Window into Nascent RNA (Mahat et al., 2024)
The work by Mahat and colleagues in the Sharp laboratory represents a significant methodological breakthrough, successfully adapting the principles of nascent RNA sequencing to the single-cell level. By doing so, scGRO-seq provides a means to directly observe the dynamic, and often ephemeral, process of transcription in individual cells, unveiling coordinated regulatory programs that are obscured by bulk methods.
The paper addresses some key limitations and challenges, such as barcoding of nascent RNA, which lacks poly(A) tails, and the relatively low abundance of nascent RNA at any given point in the cell. They overcome these challenges using the biology of the nuclei and bio-orthogonal click chemistry:
Intact Nuclei Run-on: The process begins with the isolation of intact nuclei. These nuclei are then subjected to a nuclear run-on reaction in the presence of a cocktail of four 3'-(O-propargyl)-modified nucleotide triphosphates (NTPs). This step is the crucial labelling phase, where actively elongating RNA polymerases incorporate a propargyl group (an alkyne) at the 3' end of the nascent RNA chain. A key detail is the use of a low concentration of the detergent, sarkosyl. Unlike in traditional PRO-seq, where high sarkosyl concentrations are used to disrupt the polymerase complex, the low concentration here is sufficient to permeabilise the nuclei for NTP entry while preserving the overall integrity of the nuclear membrane. This preservation is non-negotiable for the subsequent single-cell compartmentalisation.
Single-Nuclei Sorting: The population of nuclei, now containing propargyl-labelled nascent RNA, is sorted using Fluorescence-Activated Cell Sorting (FACS) into individual wells of a 96-well plate. This step physically separates each cell's transcriptional output.
Lysis and Click Reaction: Each well is pre-loaded with two key reagents: 8 M urea and a unique 5'-Azide-tagged single-cell barcode DNA molecule (5'-AzScBc). The urea serves to lyse the nuclear membrane and denature the RNA polymerase, releasing the propargyl-labelled nascent RNA. The stage is now set for the chemical ligation. The addition of the copper(I) catalyst initiates the CuAAC reaction, which covalently and specifically links the alkyne on the nascent RNA to the azide on the unique DNA barcode present in that well.
Pooling and Library Preparation: With each nascent RNA molecule now stably and uniquely barcoded according to its cell of origin, the contents of all 96 wells can be pooled together. This pooled sample is then subjected to reverse transcription, which is primed by the DNA barcode itself and extended with the help of a template-switching oligonucleotide (TSO). Subsequent PCR amplification generates the final sequencing library.
This workflow effectively bypasses the need for inefficient enzymatic ligations and RNA purification, instead relying on the speed and specificity of click chemistry to achieve single-cell resolution.

Key Finding I: Direct Measurement of Transcriptional Burst Kinetics
A significant contribution of the scGRO-seq study is its ability to move beyond theoretical models and provide direct, genome-wide measurements of transcriptional bursting kinetics. The authors first established de novo evidence for the bursting phenomenon. By comparing their experimental data to a permuted null model (where reads are shuffled among cells), they demonstrated that the observed number of genes with multiple RNA polymerases (termed multiplets) was significantly higher than would be expected by chance (n=828 observed multiplets vs. a much lower number in permutations, with an FDR of 0). Concurrently, the number of genes with single polymerases (singlets) was depleted. This provides strong, direct evidence that polymerases are not initiated independently and randomly, but rather in coordinated bursts. Furthermore, the physical distance between polymerases within a multiplet was significantly smaller than in the permuted controls (P<0.05, KS test), reinforcing the idea of closely-spaced polymerases firing in quick succession.
With this validation, the authors proceeded to calculate the core parameters of bursting directly. They defined a "burst window" as the first 10 kb of a gene body (excluding the promoter-proximal pause region). Given an estimated average elongation rate of 2.5 kb/min, this 10 kb window corresponds to a temporal window of approximately 4 minutes. Within this window, they could directly count the number of transcribing polymerases in each cell to estimate:
Burst Size: The average number of RNA polymerases detected per burst. Across the transcriptome, they calculated a mean burst size of 1.23, with most bursts containing between 1 and 4 polymerases.
Burst Frequency: The number of bursts occurring per allele over time. The analysis revealed a mean duration of approximately 2 hours until the next burst for a given gene, a figure that aligns remarkably well with independent estimates from imaging-based methods, such as intron seqFISH.
This direct measurement capability allowed the authors to probe the regulatory grammar of bursting. They confirmed previous findings that genes containing a TATA box in their promoter tend to exhibit larger burst sizes but lower burst frequencies (P = 4.6 × 10^-1 for burst size). They also performed a gene set enrichment analysis that associated the binding of specific transcription factors with distinct kinetic parameters. For instance, genes targeted by the transcription factor MYC were enriched for larger burst sizes, whereas genes targeted by AFF4 were enriched for higher burst frequencies.
Key Finding II: Dissecting the Cell Cycle with Histone Genes
A unique advantage of scGRO-seq is its ability to detect all nascent transcripts, irrespective of their polyadenylation status. This is a critical departure from standard scRNA-seq. The authors leveraged this to address a long-standing problem in single-cell analysis: accurately staging the cell cycle. They focused on replication-dependent histone genes, a class of genes that are essential for packaging newly replicated DNA and are known to be transcribed exclusively during the S phase of the cell cycle. Crucially, these histone transcripts are not polyadenylated and are therefore invisible to most standard single-cell methods.
By quantifying the nascent transcription of these histone genes, scGRO-seq could unambiguously identify cells in S phase. Combining this with the expression of a small number of known G1/S and G2/M marker genes, the authors were able to perform a robust hierarchical clustering that cleanly separated their 2,635 mouse embryonic stem cells into the three primary interphase stages.
This high-resolution staging enabled a fascinating observation about global cellular activity. The authors found that total nascent transcription levels were not constant throughout the cell cycle. Cells in G1/S and G2/M phases exhibited significantly higher overall transcription compared to cells in S phase (P=6.3×10−07 and P=1.2×10−06, respectively). Specifically, they quantified an approximately 40% decrease in total transcription as cells transition from G1/S into S phase, followed by a partial recovery as they exit S phase into G2/M. This provides a direct, quantitative measurement of the global transcriptional slowdown that occurs concurrently with DNA replication.
Key Finding III: Mapping Co-transcriptional Networks
The single-cell, single-molecule nature of scGRO-seq data provides an unprecedented opportunity to investigate the coordination of gene expression with satisfactory temporal resolution. The authors reasoned that by looking at nascent transcripts within their 4-minute (10 kb) window, they could identify genes that are activated nearly simultaneously.
They first examined gene-gene coordination. By calculating all pairwise Pearson correlations for binarised gene expression across single cells, they identified 800,888 significantly co-transcribed gene pairs (out of ~113 million tested). These pairs were not random; network analysis revealed 59 distinct modules of co-transcribed genes that were highly enriched for specific biological functions, including cell cycle control, RNA splicing, and DNA repair. This suggests that entire functional programs are activated in a coordinated, bursting fashion.
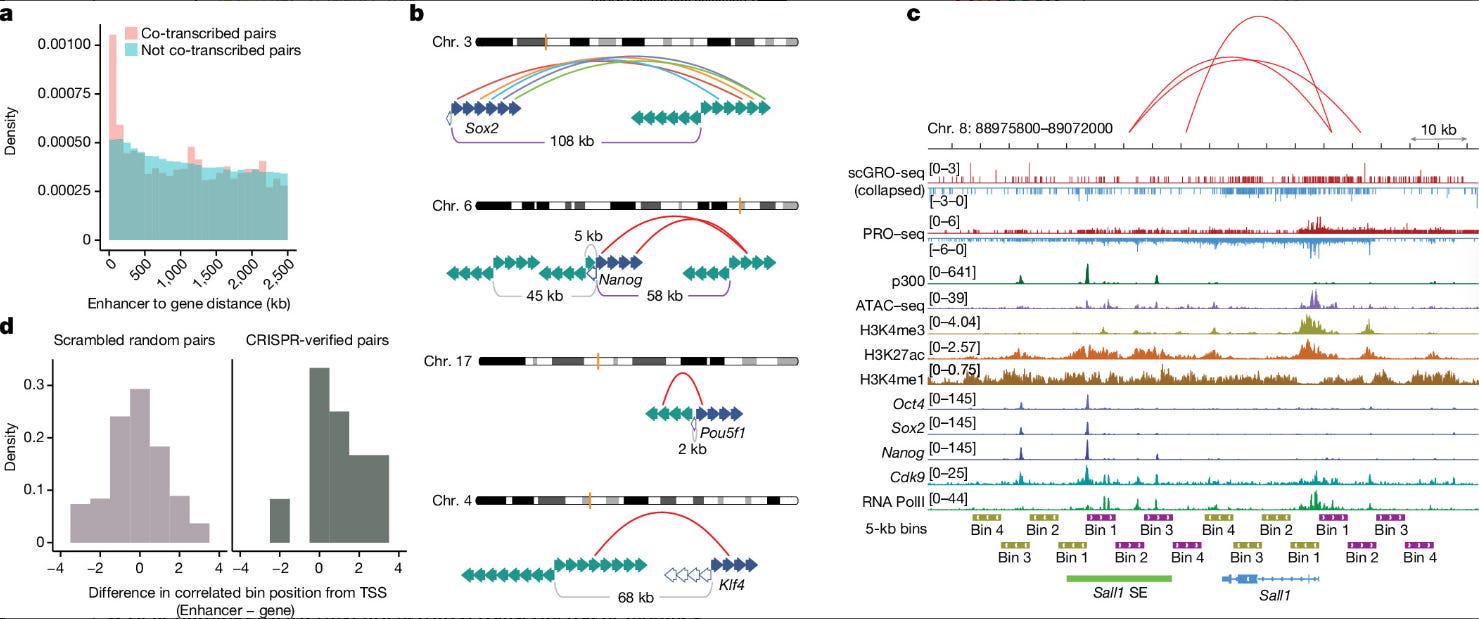
Even more compelling was the analysis of enhancer-gene coordination. Because scGRO-seq captures unstable eRNAs, it can directly measure enhancer activity in the same cell as gene transcription. The authors performed a similar correlation analysis between all expressed enhancers and genes. They identified 44,361 significantly co-transcribed enhancer-gene pairs, which were strongly enriched for proximity, with most correlated pairs located within 200 kb of each other (P = 5.5 × 10^-09, KS test).
The single-nucleotide resolution of the data allowed for a truly novel analysis of temporal ordering. For a set of validated enhancer-gene pairs, such as the one controlling the pluripotency factor Sox2, they divided the gene and enhancer into 5 kb bins (representing ~2-minute transcription windows) and looked for correlations at this finer scale. Their analysis revealed that the correlated enhancer bin was generally further from its own transcription start site than the correlated gene bin was from its promoter. This provides the first direct, genome-wide evidence for a long-hypothesised model: that transcription at the enhancer often initiates before transcription at its target gene promoter, suggesting a temporal cascade where the enhancer "fires" first to activate the gene.
The true power of scGRO-seq, therefore, lies in its capacity to translate genomic distance into transcriptional time. The method captures the precise genomic coordinate of each elongating polymerase. By assuming a reasonably constant elongation rate, this spatial information on the DNA template is converted into temporal information about the transcription process. This is the conceptual leap that enables the authors to move beyond simply quantifying what is expressed to asking when it is expressed in relation to other events within the same cell. It transforms the genome from a static sequence map into a dynamic chronometer, enabling the study of the kinetics and choreography of gene regulation at a scale previously unimaginable.
Part 2: SPACECAT – Spatial Precision for Transcriptional Context (Genshaft et al., 2021)
While scGRO-seq provides a window into the temporal dynamics of transcription, it does so at the expense of spatial information. The work by Genshaft and colleagues in the Shalek laboratory addresses this complementary challenge. Their method, SPACECAT (Spatially Photoactivatable Colour-Encoded Cellular Address Tags), provides a robust and versatile framework for labelling cells based on their location within a live tissue, thereby preserving their all-important spatial context for downstream molecular analysis.
The Methodological Innovation: Spatially-Addressable Live Cell Tagging
The core challenge that SPACECAT overcomes is the fundamental incompatibility between spatial context and dissociation-based single-cell assays. How can one determine the transcriptome of a cell from the invasive margin of a tumour when the process of getting that cell's RNA requires removing it from the tumour? The SPACECAT workflow provides an ingenious solution based on photocaging chemistry.
Synthesis of a Caged Dye: The authors first designed and synthesised a novel chemical probe, which they term calcein NVOC. Calcein is a well-known, cell-permeable dye that becomes brightly fluorescent inside viable cells and is commonly used to assess cell health. In their custom probe, the authors chemically attached photolabile nitroveratryloxycarbonyl (NVOC) groups to the carboxylate moieties of calcein that are essential for its fluorescence. This "caged" version, calcein NVOC, is cell-permeable but non-fluorescent.
Staining: Live cells, organoids, or fresh tissue slices are incubated in a solution containing calcein NVOC. The small molecule readily diffuses into all cells within the sample.
Photoactivation: This is the key step for spatial encoding. The sample is placed on a microscope equipped with a digital micromirror device (DMD). This device acts like a tiny projector, allowing the user to draw a region of interest (ROI) on the live image and illuminate only the cells within that ROI with a brief pulse of near-UV light (405 nm). In the illuminated region, the light cleaves the NVOC cages from the calcein molecules, instantly "uncaging" them and rendering them fluorescent. Cells outside the ROI remain dark.
Isolation and Downstream Analysis: The sample, now containing a population of fluorescently tagged cells at a known prior location, can be handled in two ways. It can be monitored over time to track cell migration or dynamics, as the fluorescence signal is stable for at least 16 hours. Alternatively, the entire tissue can be immediately dissociated into a single-cell suspension. The fluorescently "painted" cells can then be easily isolated from the untagged population using Fluorescence-Activated Cell Sorting (FACS). These sorted, live cells are then available for any number of downstream assays, including scRNA-seq, flow cytometry for protein analysis, or functional studies.
Key Application I: Isolating Stem Cell Niches in Human Intestinal Organoids
To validate the precision and utility of SPACECAT, the authors turned to a well-characterised 3D biological structure: human intestinal organoids. These "mini-guts" grown in culture recapitulate the architecture of the native intestine, including the formation of crypt-like protrusions that are known to be niches rich in highly proliferative, stem-like cell populations.
The experiment was a direct test of the method's ability to enrich for a known, spatially-defined cell type. The researchers used SPACECAT to specifically photoactivate cells within these protruding crypt regions across approximately 20 organoids. After photoactivation, the organoids were dissociated, and the fluorescent (calcein NVOC+) cells were isolated by FACS and profiled using single-cell RNA sequencing (scRNA-seq), alongside non-photoactivated control cells from the same batch.
The results were a striking confirmation of the method's efficacy. The scRNA-seq data from the isolated cells revealed a significant enrichment for cells expressing canonical intestinal stem cell markers, including OLFM4 and LRIG1. Furthermore, cell cycle analysis revealed that the photoactivated population was significantly enriched for cells in the S and G2/M phases compared to the control population (p<0.001, Chi-squared test), consistent with the known proliferative nature of the crypt niche. Importantly, a comparison of gene expression between photoactivated and non-photoactivated stem cells revealed no significant signatures of cellular stress or damage, indicating that the photoactivation process is minimally perturbative. This experiment served as a powerful proof-of-principle, demonstrating that SPACECAT can successfully target and isolate specific functional zones from a complex, 3D human tissue model.

Key Application II: Uncovering Spatial Heterogeneity in the Tumour Microenvironment
Having validated the method, the authors next applied SPACECAT to a problem of discovery: mapping the spatial heterogeneity of a complex, diseased tissue. They used the well-established Kras-p53 (KP) genetically engineered mouse model of lung adenocarcinoma, which faithfully recapitulates many aspects of human lung cancer.
The researchers dissected tumours from two mice, prepared live tissue slices, and used SPACECAT to label cells specifically at the interface between the tumour and the adjacent healthy lung tissue—the "Healthy/Tumour Border." These spatially-defined cells were isolated by FACS, and their transcriptomes were compared to those of cells from the dissociated "Whole Tumour" using the Seq-Well platform for scRNA-seq.
The analysis uncovered profound inter- and intra-tumour spatial heterogeneity. While all expected cell types (tumour, lymphoid, myeloid) were found in both samples, their proportions varied. Most notably, the population of "Monocytes or Macrophages" showed a significantly different abundance at the border compared to the tumour core in both animals analysed (Benjamini-Hochberg-adjusted p<0.001). In Tumour 1, this population was expanded at the border, while in Tumour 2, it was decreased. This highlights not only spatial organisation but also significant variability between individual tumours.
Digging deeper, the authors found that even within a single cell type, gene expression programs were spatially dependent. Monocytes and macrophages isolated from the border region expressed a different set of genes compared to their counterparts from the tumour core. For example, genes such as Tnf and Il1rn were differentially expressed between the two locations in both tumours. By creating a "Healthy/Tumour Border Score," the authors could rank all monocytes and macrophages along a continuous spatial axis, revealing smooth gradients of gene expression related to inflammatory response, cell adhesion, and metabolism. This demonstrates SPACECAT's power not only for validating known structures but also for discovering novel, spatially organised biology in a complex disease model.

The paramount innovation of SPACECAT, however, is not merely the act of spatial tagging, but the preservation of cellular viability. This feature fundamentally alters the experimental possibilities. The vast majority of high-resolution spatial transcriptomics technologies, such as MERFISH or Slide-seq, require chemical fixation of the tissue as a first step. This provides a static, high-resolution map, but the cells are dead, and the experiment is terminal. SPACECAT breaks this paradigm. By design, it yields a population of live, spatially-defined cells. This seemingly simple difference has profound implications. A cell isolated via SPACECAT is not limited to a single transcriptomic measurement. It can be subjected to a cascade of subsequent functional assays. One could profile its proteome by flow cytometry, measure its secretome, assess its biophysical properties, or even place it back into culture to observe its long-term fate, migratory potential, or response to therapeutic agents. This capability transforms spatial analysis from a purely observational technique into a powerful preparative tool for multi-modal, functional genomics. It elegantly bridges the gap between seeing where a cell is and understanding what that cell can do.
A Comparative Overview of Nascent RNA Sequencing Technologies
As a researcher, the choice of method to use for understanding nascent RNA transcription always boils down to a balance between the research aim and which method can address this aim in a meaningful manner.
GRO-seq offers a foundational, albeit lower-resolution. PRO-seq offers single-base precision, making it ideal for studying polymerase pausing; however, it has historically been a technically demanding protocol that requires large amounts of starting material. Methods based on metabolic labelling, such as TT-seq, offer an alternative but can be confounded by the capture of already processed RNAs. NET-seq provides a direct readout of polymerase-associated transcripts but can be biased towards capturing paused polymerases. scGRO-seq's unique value proposition lies in its ability to provide nascent transcript data at the single-cell level, a feat that no other method has achieved. However, this comes at the cost of lower capture efficiency and an inability to resolve promoter-proximal pausing, a direct consequence of the low-detergent conditions required to maintain nuclear integrity.

A Comparative Overview of Spatial Transcriptomics Technologies
The field of spatial transcriptomics is even more diverse, but can be broadly categorised. A primary distinction is between methods that perform sequencing in situ versus those that enable the isolation of spatially defined cells for downstream analysis. Sequencing-based methods, such as 10x Genomics' Visium, provide unbiased, whole-transcriptome data; however, these data are collected from spots that contain multiple cells, thereby lacking actual single-cell resolution. Imaging-based methods, such as MERFISH or NanoString's CosMx, achieve stunning subcellular resolution but are limited to a pre-defined panel of hundreds to thousands of genes and require fixation. SPACECAT occupies a unique and powerful niche within the category of image-guided isolation methods. Its resolution is defined by the precision of the light pattern and the fidelity of the FACS sort, and the sorting process limits its throughput. Its singular, transformative advantage, however, is that it yields live cells, opening the door to a vast array of functional and multi-modal assays that are impossible with fixed-tissue methods.

Limitations and challenges
For scGRO-seq, the authors mention the following limitations. Firstly, the low concentration of sarkosyl detergent is essential for maintaining nuclear integrity during single-cell sorting. The use of the lower concentration is insufficient for the efficient release of the promoter-proximal paused RNA Polymerase II complexes. The consequence of this is that scGRO-seq is essentially blind to the regulatory state captured by PRO-seq. Secondly, the capture efficiency of 10% for nascent RNA transcripts remains lower than that for capturing more abundant, stable mRNAs in standard scRNA-seq protocols. This is a key bottleneck and can limit the depth of information that can be recovered from a single cell. Additionally, one can infer that the method relies on a constant polymerase elongation rate to make inferences on the rate and dynamics of the transcriptional burst. But in cells, it is known that these rates can vary by several orders of magnitude under different cellular conditions and stimuli.
For SPACECAT, their use of standard epifluorescent microscopy limits the depth of photoactivation depending on the type of tissue. Also, their study notes that some degree of cross-contamination occurs in species-mixing sorting experiments. These can be addressed to a certain degree computationally, but one must still be mindful when designing the experiment. Another aspect is the presence of phototoxicity; however, the study reveals no significant signs of cell death or activation of a stress response. Although the inertness of the chemical byproducts of NVOC cleavage must be demonstrated along with various studies on which range of wavelengths of light and their exposure times give rise to transcriptional changes. This, I believe, will give us a better idea to implement these NVOC-based methods in live cell spatial omics platforms.
Future Trajectories: The Convergence of Nascent and Spatial Genomics
While these two papers address distinct axes of gene regulation—the temporal and the spatial—their true power may lie in their potential convergence. scGRO-seq provides the "when" but loses the "where." SPACECAT provides the "where" but, as published, measures the steady-state "what." The logical and tantalising next step is to fuse these capabilities. One can envision a workflow where SPACECAT is first used to photo-label a specific cellular population in a live tissue slice, for instance, T-cells in direct contact with a tumour cell. These labelled cells could then be isolated by FACS, their nuclei extracted, and those specific nuclei subjected to the scGRO-seq protocol.
The potential of such an integrated approach is profound. It would enable researchers to ask questions that are currently unanswerable. How do the transcriptional bursting kinetics of a neuron change in response to a localised synaptic input? Does an immune cell at the invasive front of a tumour exhibit a different nascent transcriptional landscape than one deep within the tumour core? This represents a move towards true 4D transcriptomics—capturing instantaneous transcriptional activity (t) within a defined three-dimensional space (x, y, z). The technical hurdles would be significant, primarily revolving around the challenge of obtaining sufficient high-quality material from a doubly selective process. Yet, the potential reward—a truly dynamic and spatially resolved view of the genome in action—is a worthy goal for the field. The potential for combining these approaches is tantalising; I would be keen to hear the Community's thoughts on the primary technical hurdles to overcome. Please share your perspective in the comments.
Conclusion: Redefining the "State" of a Cell
The two methodologies explored in this report — scGRO-seq and SPACECAT — are more than just clever new tools. They represent a fundamental advance in how we can define and interrogate the "state" of a cell. For years, the single-cell field has broadly defined cell state and type through clustering based on the steady-state abundance of mature messenger RNA (mRNA). scGRO-seq challenges this by offering a more dynamic definition, characterising a cell by its instantaneous transcriptional output—the genes it is actively expressing at a precise moment in time. SPACECAT, in parallel, enriches this definition by adding a critical dimension of context, defining a cell's state by its location and neighbourhood within the complex ecosystem of a tissue.
Scientific progress is often marked not by singular, revolutionary discoveries but by the incremental and ingenious development of new ways of seeing. By fusing precision chemistry with molecular biology, these methods provide new lenses through which to view the genome. They allow us to move from static snapshots to dynamic movies, from dissociated cell suspensions to intact tissue architectures. They replace coarse-grained averages with single-molecule, single-cell precision.
The path forward will undoubtedly involve integrating these and other emerging technologies. As we continue to refine our ability to measure transcription with ever-finer temporal and spatial resolution, we must be prepared to revise our foundational models. As we move from a world of static clusters to one of dynamic trajectories and spatial gradients, how will our very definition of a "cell type" need to evolve to accommodate this new, dynamic, and four-dimensional reality?
Should this deep dive into nascent and spatial technologies prove valuable, a 'like' or share is always appreciated, as it helps guide the focus of future reports.
References:
Mahat, Dig B., Nathaniel D. Tippens, Jorge D. Martin-Rufino, Sean K. Waterton, Jiayu Fu, Sarah E. Blatt, and Phillip A. Sharp. 2024. “Single-Cell Nascent RNA Sequencing Unveils Coordinated Global Transcription.” Nature 631 (8019): 216–23. doi:10.1038/s41586-024-07517-7.
Genshaft, Alex S, Carly G. K. Ziegler, Constantine N. Tzouanas, Benjamin E. Mead, Alex M. Jaeger, Andrew W. Navia, Ryan P. King, et al. 2021. “Live Cell Tagging Tracking and Isolation for Spatial Transcriptomics Using Photoactivatable Cell Dyes.” Nature Communications 12 (1): 4995. doi:10.1038/s41467-021-25279-y.
Lu, Dan, Marjan Faizi, Bryon Drown, Alina Simerzin, Joshua François, Gary Bradshaw, Neil Kelleher, Ashwini Jambhekar, Jeremy Gunawardena, and Galit Lahav. 2024. “Temporal Regulation of Gene Expression through Integration of P53 Dynamics and Modifications.” Science Advances 10 (43): eadp2229. doi:10.1126/sciadv.adp2229.
If you've read this far, I sincerely thank you for taking the time to go through my thoughts. I'm also experimenting with different formats, so please leave a comment with what you liked or disliked. Lastly, once a month (or less), I will share a comprehensive report on biotech investment ideas I come across. These reports will be paywalled after 7 days, so stay tuned.