Tech Focus: How Proximity Network Assay Reveals the interactions on the cell surface
The technology that caught immune cells stealing parts from their targets.

Dear Community,
2D representations of cells might significantly hinder the conveyance of the cell surface's complexity. I vividly recall observing an onion peel under the microscope in year 6, captivated by the intricate arrangements of cell layers, with the nucleus slightly off-centre in many cells, showcasing the repetitive beauty alongside subtle variations in the cell wall and membrane. It was my first encounter with microscopy, a wonderful experience that allowed me to appreciate the diverse structural variations of nature. Within a cell, a universe akin to Russian nesting dolls exists. The beauty of it is that proteins often adorn the cell layers layer by layer.
Proteins are the tireless workforce of the cell; they are builders, messengers, managers, and responders. Proteins largely maintain the fundamental infrastructure of life's programmes. For several decades, scientists have skillfully built a comprehensive understanding of this workforce through proteomics, precise genetic studies, and various microscopic assays to assess their functions and locations.
Imagine this as a large conglomerate performing various tasks. Although the role of a single individual may be well defined within the group, it is their interactions with others that foster collaboration and drive unique innovations for a successful organisation.
Similarly, the proteins in your cell, or any cell for that matter, and their interactions can determine the cell's functional fate. To understand the organisational dynamics, collaborations, and alliances, a detailed and precise organisational chart is necessary.
Furthermore, it is crucial to understand who is meeting whom, which teams are collaborating, and how these connections evolve in response to new directives. This grand challenge of the cellular world is mapping the interactome, the dynamic social network of proteins that dictates cellular behaviour.
In this post, let's explore a new method proposed by Pixelgen, which we previously discussed in a Molecular pixellation study.


Connecting the dots: An investigator’s dilemma.
Over the years, investigators have heavily relied on techniques like two-hybrid assays, co-immunoprecipitation, and other localisation methods to identify the protein partners within cells. Although these methods are powerful, they have limitations, such as extracting proteins from their native cellular environment, which results in the loss of several important contextual interactions. The development of additional methods also extensively depended on prior knowledge and some hypotheses to test interactions, often involving only a few proteins at a time. The pairwise nature of these surveys restricts the ability to ask more complex questions about the topological aspects of protein organisation, membrane dynamics for protein reorganisation, and the various migratory mechanisms cells utilise, as well as how protein localisation can, in turn, affect these processes. A hypothetical scenario in cancer metastasis involves cells dislodging and preferentially migrating to specific organs, leading to secondary metastasis. If it becomes possible to detect membrane and protein localisation dynamics and develop small molecule inhibitors that specifically prevent a group of proteins from polarising the cell for movement, this could, in theory, reduce the occurrence of secondary metastatic events.
While we have had plenty of tools to measure the relative abundance of proteins in cells, it was often at a cost of resolution. ie, Mass spectrometric methods are super sensitive but typically require millions of cells as input. However, this is changing with the introduction of single-cell mass spectrometric methods, but some challenges and kinks still remain in these methods. As days pass, progress will be made to develop a platform that can sensitively measure proteins at the single-cell level.
What has been conspicuously absent is a technology that offers the trifecta: high-multiplexing (analysing many proteins at once), high-resolution, and high-throughput single-cell analysis. This is the gap that the Proximity Network Assay (PNA), a new technology from Filip Karlsson, Simon Fredriksson, and their colleagues at Pixelgen Technologies, aims to fill. It’s a conceptual leap beyond our previous discussion on Molecular Pixelation (MPX). While MPX creates a spatial map of where proteins are located, PNA constructs a network of how they are interacting.
A refresher on foundational Methodologies.
PNA builds on a platform of rolling circle amplification. The same RCA-based analysis was used in IGP at Uppsala University while I was a rotational student in Ulf Landegren's lab. Very broadly, the core idea is to use DNA as both a barcode to identify molecules and as a ruler to measure distances between them, thereby entirely circumventing the physical limitations of light microscopy. The predecessor methods, such as Proximity Ligation Assay (PLA) and Proximity Extension Assay (PEA), are highly successful methods that are now commercially available for scientists in their laboratories
In a typical PLA, two antibodies, which are attached to a short strand of DNA, bind to two different proteins of interest. If these proteins are close neighbours, the strands can be enzymatically joined by a connector oligonucleotide to form a unique sequence, which is consequently amplified and detected. The limitation, as stated previously, is that this can only answer a binary question, ie Is Protein A in the near neighbourhood of protein B? High multiplexity of the analysis is usually limited by the prohibitive cost of antibodies and potential off-target effects.
Pixelgen’s own technology, Molecular Pixelation, made a significant advance here by using a zoning-based approach. Proteins within the same zone were considered neighbours, and this allowed for a more holistic view of the protein co-localisation within these zones and achieved an approximate resolution of 280nm.
The principal workflow of PNA
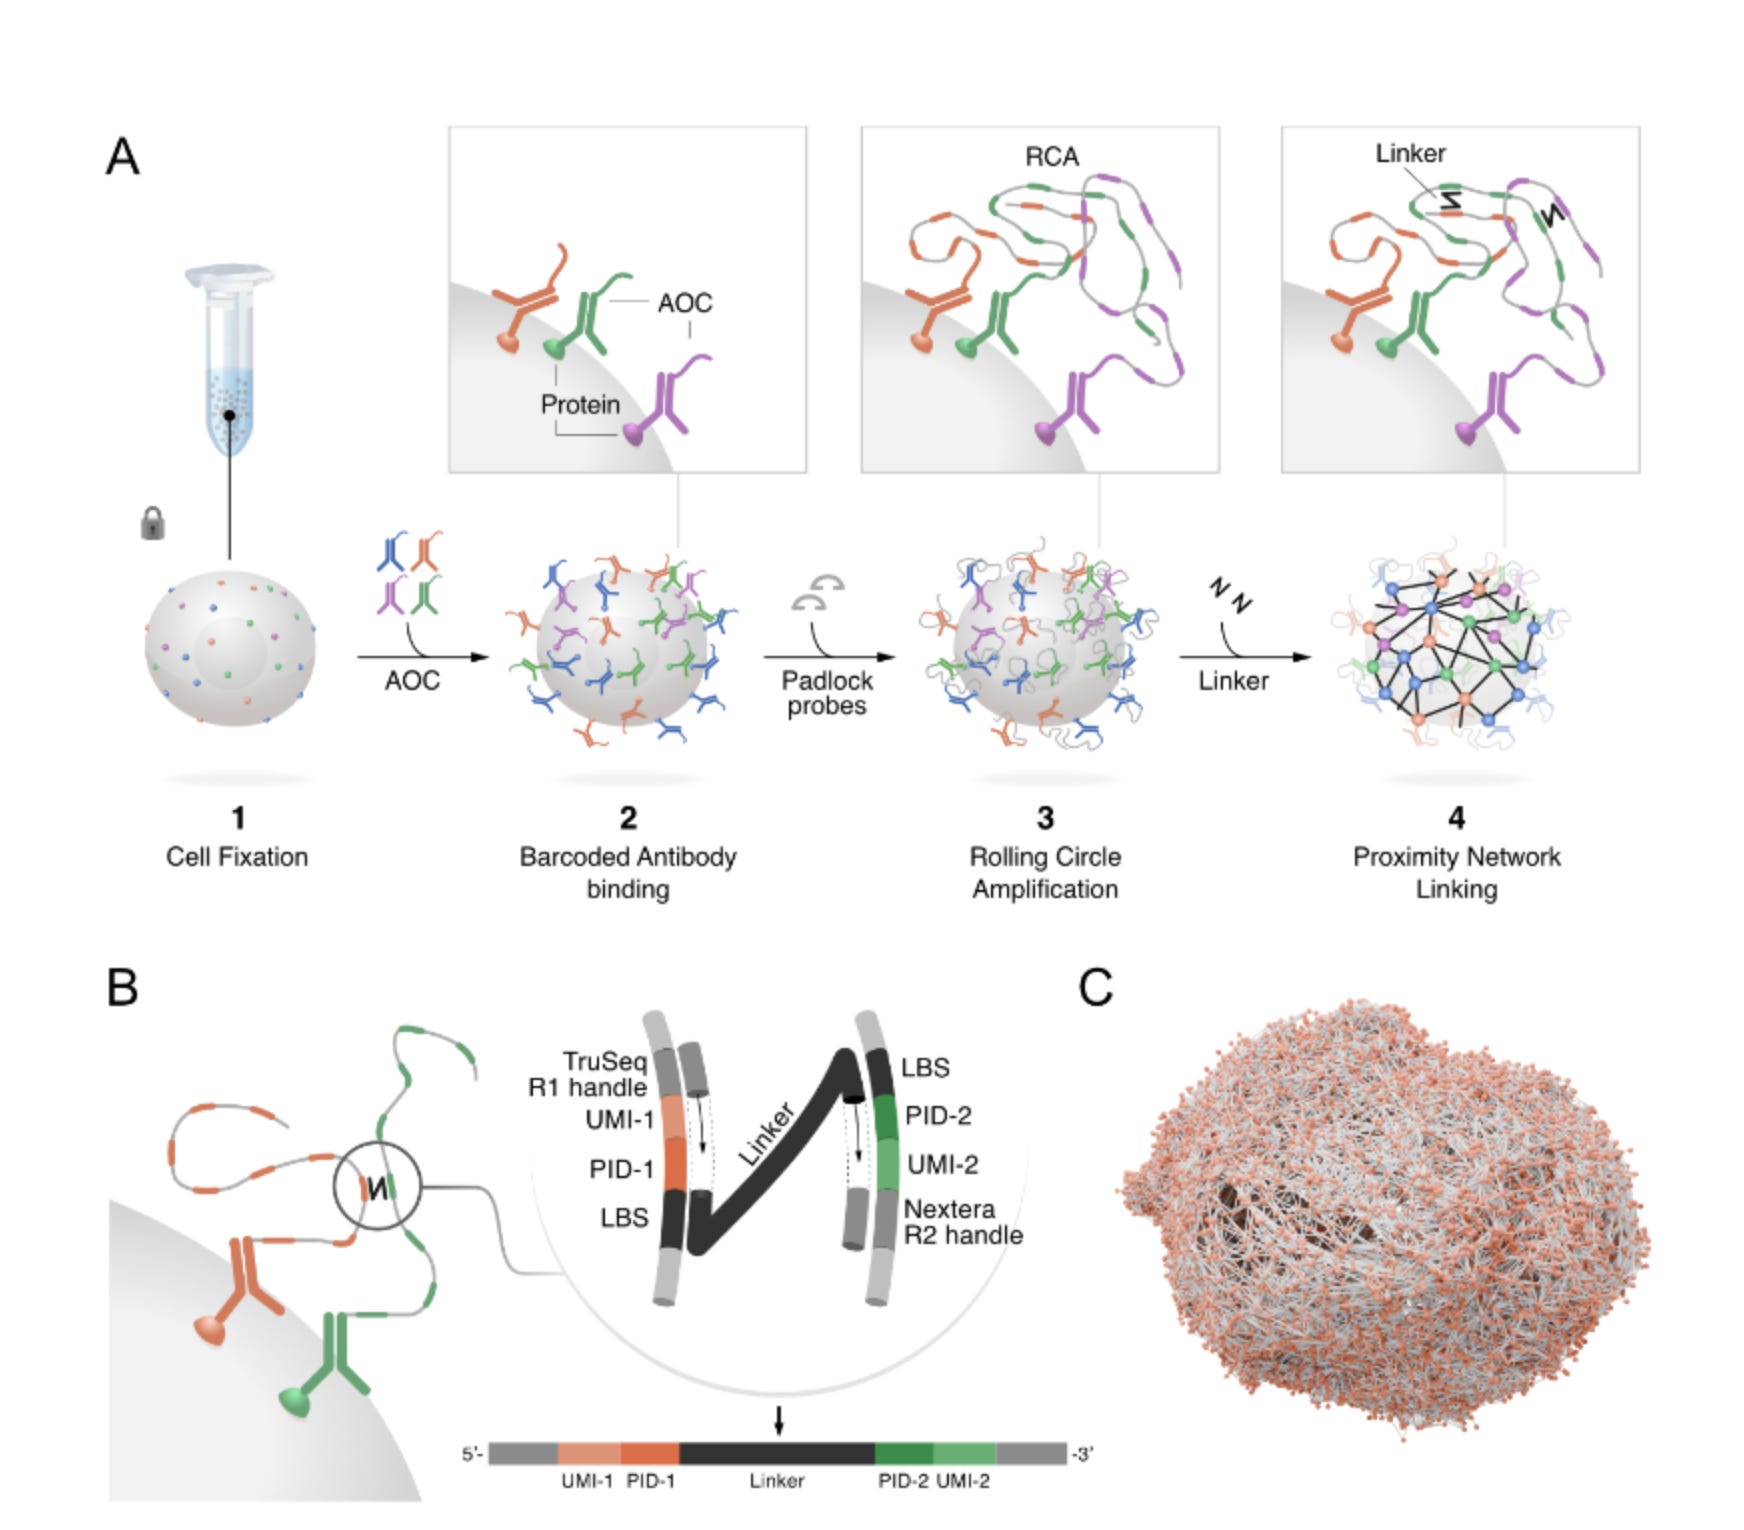
The authors provide a clear overview of the workflow in their article; at a glance, it is a quite straightforward method that relies on a set of basic laboratory techniques. Let's break it down into its individual steps.
Antibody tagging: The cells are stained with a panel of antibodies, each designed to bind to a specific protein and linked to a unique DNA barcode that identifies the protein. The Antibody barcodes have two specidfic versions to avoid any possible self interactions in the downstream events.
Generation of Nodes: RCA is used to amplify the padlock probe (details of how this happens are discussed in my earlier posts). This creates a long, localised strand of DNA containing copies of the protein’s barcode. You might think of it as planting a uniquely patterned flag at the location of every protein, creating a “spatial node”.
Linking the Network: Next, a “linker” molecule is introduced. This linker is designed to physically connect two nearby RCA products. This is achieved through an enzymatic step. The barcodes from two neighbouring nodes are copied onto this linker, which creates a new single DNA molecule that contains the identities of both proteins. This molecule is the physical record of a spatial link- an edge in the protein network.
Sequencing and Reconstruction: The linker molecules are collected and by utilising a next-generation sequencer such as Illumina Novaseq, the recorded links can be sequenced. Because each cell has a unique combination of interconnected barcodes, the entire network for each individual cell can be computationally reconstructed.
One of the proposed key advantages of using PNA is that it doesn't require additional steps to enclose the cell in a compartment, which is often necessary in 10x-related scRNAseq. The products generated by PNA are cell membrane-bound, allowing for the testing of the abundance and spatial locations of various membrane-bound proteins and macromolecules. A key part of their analysis is the generation of a Proximity Score. Think of this score as a “friendship detector”. The authors, through their computational pipeline, devised a method to firstly count how often two proteins actually interact in a real cell. Next, they simulate the same cell 100 times with the proteins placed randomly. By counting the connections in the random versions and taking an average, they can compare the real connections with these simulated averages. If proteins connect twice as often as in randomness, you can assign a score of 1. Four times as often, it gets a score of 2. This assigned score then enables the authors to identify which proteins are genuinely working together versus those that are close to each other by chance.
Testing PNA: Key Findings
Any new technology paper should showcase the flexibility and practical applications of the proposed technology. As seen multiple times in my previous posts, most technologies are applied in various scenarios to demonstrate their use case, adaptability, and understanding of different systems and processes.
Validation of Protein Network in B cells.
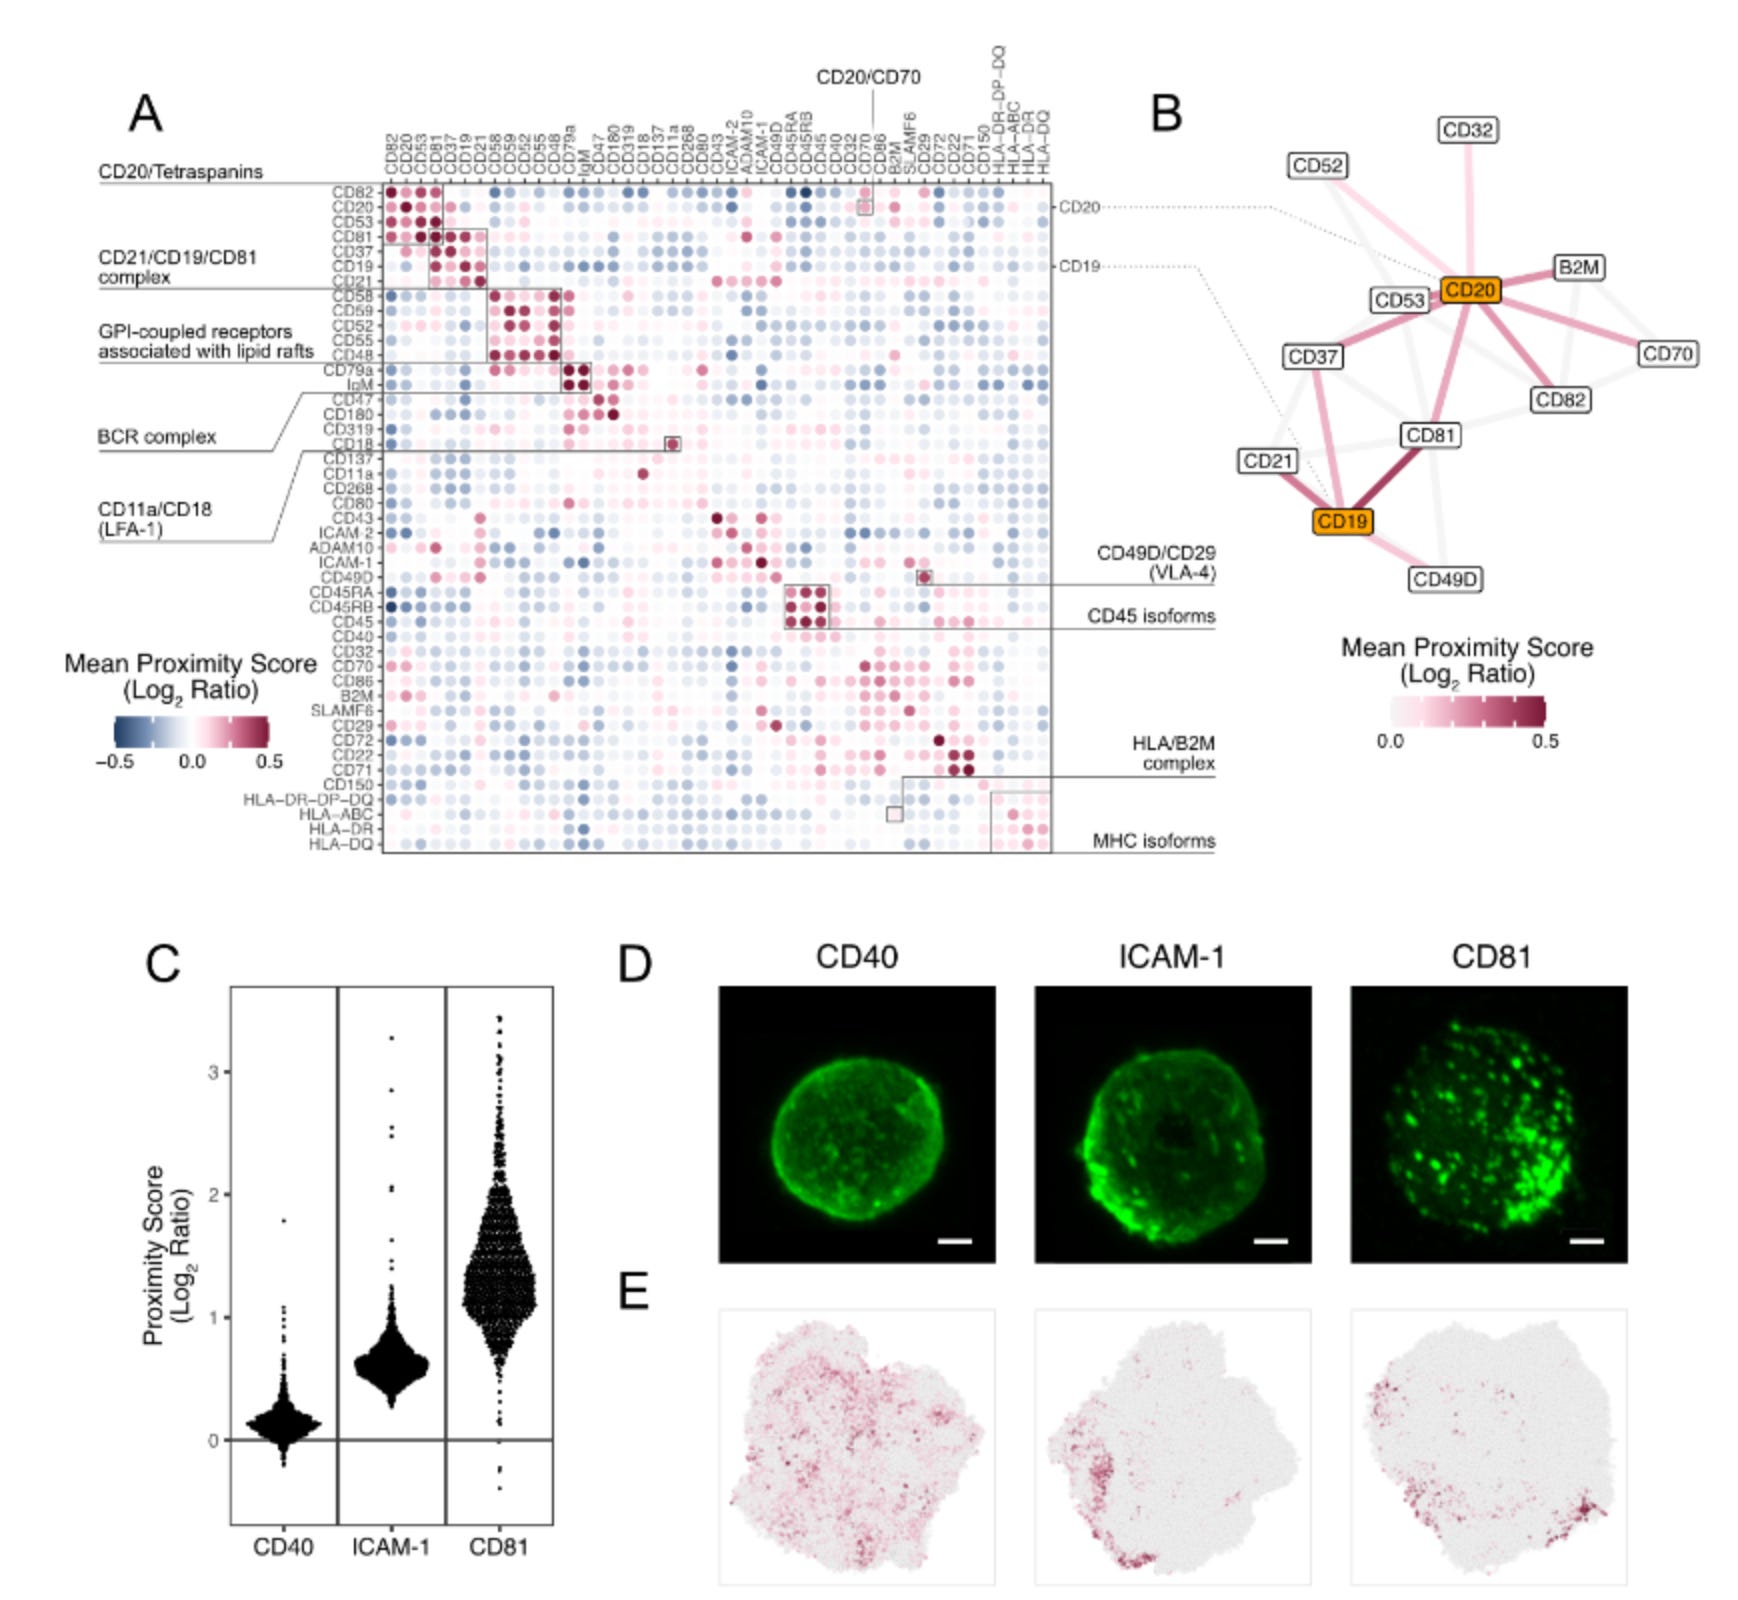
The authors tested their Proximity Network Assay using Raji cells, a common B cell line, analysing over 1,000 cells to determine if PNA could accurately detect known protein partnerships. They sought classic protein complexes and membrane structures. The method successfully identified well-established interactions such as the B cell receptor complex (CD79a/IgM), integrin complexes, and membrane microdomains. To verify their computational predictions, they compared Proximity Scores with actual microscopy images and found strong agreement—proteins with low clustering scores, like CD40, showed even distribution under the microscope, while high-scoring proteins like CD81 exhibited the expected clustered patterns.
Key Novel Discoveries:
Interconnected Networks: CD19 and CD20, two major B cell proteins, are linked through shared tetraspanin partners, revealing coordinated membrane organisation
CD21's Dual Life: This important receptor lives in two distinct neighbourhoods—the classical B cell co-receptor complex AND a separate adhesion-rich domain with molecules like CD54 and CD102
Confirmed New Interaction: Spatially validated the recently discovered CD20-CD70 partnership
Deep Phenotyping of Heterogeneous Immune Populations
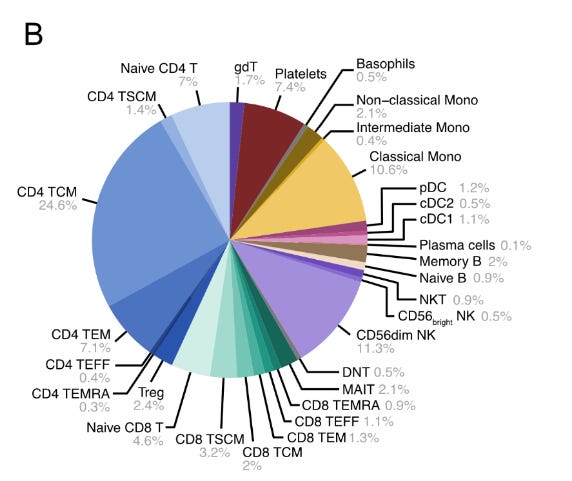
The authors then scaled up their approach, deploying a comprehensive 155-protein panel on peripheral blood mononuclear cells (PBMCs)—essentially testing whether PNA could handle the complexity of real clinical samples containing multiple immune cell types all mixed together. Think of this like trying to identify different types of people at a massive, crowded festival where everyone is wearing various combinations of identifying badges. Using a hierarchical gating strategy that progressively narrowed down cell identities, they aimed to classify 34 distinct immune cell types from the mixed population. This represented a major stress test: could PNA maintain accuracy while simultaneously analysing abundance, spatial organisation, and cell identity across diverse immune populations?
Key insights of this test:
Near-Perfect Classification: Successfully identified 30 out of 34 targeted cell types, including all major PBMC lineages (T cells, B cells, NK cells, dendritic cells, monocytes)
Rare Population Detection: Caught even small contaminant populations like platelets (CD41+, CD45-) and basophil granulocytes (CD66b+, CD193+)
Flow Cytometry Validation: Achieved remarkable concordance with gold-standard flow cytometry (Pearson's r = 0.99) across multiple donors.
Cell types clustered appropriately on UMAP plots—memory T cell subsets grouped together but remained distinct from naive populations
Marker Detection: Identified population-specific markers like TCR variants (TCRγδ, TCRVδ2, TCRVγ9) exclusively in gamma delta T cells
The standout achievement was demonstrating that PNA can simultaneously perform cell identification, abundance quantification, and spatial protein analysis in heterogeneous clinical samples—essentially doing the job of multiple traditional methods in a single assay while maintaining accuracy.
PNA shows evidence of torgocytosis by CAR-T cells
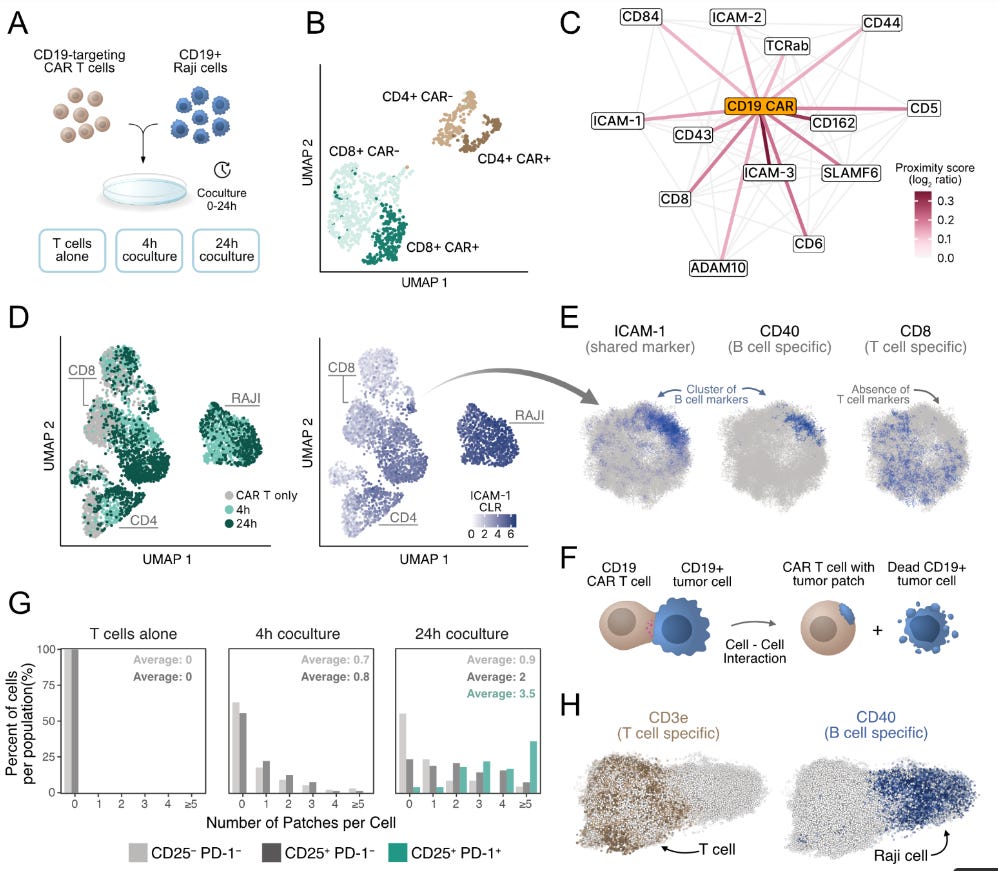
To demonstrate the application of PNA in understanding cellular remodelling. The authors used engineered immune cells called CAR-T cells, which are essentially reprogrammed to recognise tumour antigens in patients, and were utilised in cell culture assays. The authors used CD19-targeting CAR-T cells co-cultured with CD19+ Raji tumour cells. The analysis involved comparing stand-alone proximity networks and co-cultured networks. This analysis showed that the CD19 CAR receptor integrates into endogenous TCR-associated signalling domains. The time course experiment also analysed the surface proteome changes at 4 and 24 hour intervals.
Key insights of this test:
CAR Receptor Integration: The synthetic CD19 CAR does not randomly scatter across the cell surface—instead, it integrates explicitly into natural TCR-associated signalling domains while actively avoiding lipid raft compartments.
Native-like Behaviour: Despite being an artificial receptor, the CAR mimics natural TCR spatial organisation, suggesting engineered receptors can "hijack" existing cellular architecture.
Membrane Theft Visualisation (Trogocytosis): PNA showed that T cells were literally stealing pieces of tumour cell membrane (trogocytosis), appearing as distinct patches enriched with B cell markers like CD40 and ICAM-1.
Exhaustion Correlation: Exhausted T cells (CD25+ PD-1+) carried approximately five times more tumour patches than non-activated cells, suggesting trogocytosis might serve as a biomarker for T cell dysfunction.
Single-cell resolution: individual cells exhibited 0-3+ tumour patches, exposing previously hidden heterogeneity in CAR-T cell behaviour.
Distinct from Conjugates: Could distinguish membrane theft from direct T cell-tumour conjugates, where markers remained spatially separated.
Identification of Disease programs using Systemic Lupus as a model
The authors have laid a solid groundwork for the utility of PNA in various settings. The following experiment marks a transition into clinical mechanistic discovery. The fundamental question that remains, post-addressing known interactions, understanding cell proportions, and capturing cellular remodelling dynamics, is how to use PNA to understand new mechanisms that traditional methods miss.
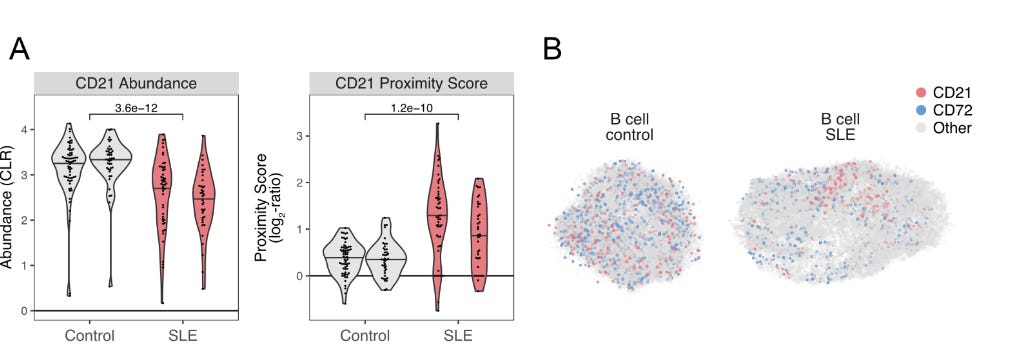
SLE is an autoimmune disease involving antibodies attacking the patient's own tissues, causing systemic inflammation and organ damage. Scientists have long known that CD21 is a crucial receptor that regulates B cell activation and is decreased in SLE patients (They frequently observed CD21low B cell populations in comparison to normal controls). The utilised PNA to survey two patients and two controls (granted it is a small population, but since it is a demonstration, let's overlook this). Their findings show that they could confirm lower expression of CD21 in patients as reported previously. Additionally, the PNA network demonstrated some level of polarisation that was not previously reported. The functionality of this polarisation is a bit speculative at the moment, but this is exciting as it offers a method to longitudinally study progressively degenerating diseases, not limited to SLE.
Conclusion: The themes of method development
When it comes to method development, especially in biology, iterations are essential for maintaining a continuous streak of innovation. In my view, using RCA as a key tool across diverse platforms—such as O-Link, Xenium, Navinci Diagnostics’ Naveni® platform, and this PNA—depends on iterative innovations centred around a core biological feature: the padlock probe design and RCA products. These are employed in various ways to facilitate research tool development. Similarly, Molecular Pixellation and Proximity Network assays present innovative approaches to addressing longstanding questions about cell surface receptor or molecule zonation and interactions. It will be fascinating once researchers begin discovering new applications for experimentation in clinical and basic research. For instance, as a molecular virologist, I wonder how viruses engage cell surface receptors and induce remodelling of the cell surface to facilitate endocytosis. Although studies have explored this, PNA will enable a much more detailed view of the movement and clustering of receptors and potentially macromolecules that assist in receptor entry. Other fields of research may also open up; for example, in cancer research, understanding the cell surface in secondary metastatic events and distinguishing receptor combinations that allow secondary metastases to establish in other organs could lead to novel methods to inhibit disease progression. Alternatively, one could, in theory, use organoid models of diseases undergoing experimental therapies to see the effects of the treatments on the cellular level in context with other cells. The potential for such technologies to mature and be applied across different domains is purely a function of time. I hope this overview was insightful and maybe sparks an idea that you can pursue.
PS: Once I get around to fixing my cluster to run the PBMC unstimulated data published, I will likely give a summary follow-up on data analysis, which will probably be hosted via GitHub. Stay tuned!
References
Karlsson, Filip, Michele Simonetti, Christina Galonska, Max Karlsson, Hanna van Ooijen, Tomasz Kallas, Divya Thiagarajan, et al. 2025. “Single-Cell Protein Interactomes by the Proximity Network Assay.” bioRxiv, 2025.06.19.660329. doi:10.1101/2025.06.19.660329.
If you have made it this far, please consider sharing the article and subscribing. This simple act helps keep my motivation alive to write more often. I used to write weekly, but I am currently busy parenting two under-two children! My writing is limited to one hand, as shown in the image below. I am mostly tired and occupied with tasks and my thesis writing, while squeezing in time to keep my knowledge current and alive. It is a hard act to balance. Thank you for reading and sharing.