


Bridging the Gap Between Gene Expression and Metabolism: A New Technology for Spatially Resolved Multimodal Analysis
Ex Vetere Novum

Dear Members of the community,
I am writing to inform you that I had taken a break from writing this newsletter for the past few months due to personal reasons (Getting married being one). I had been working hard to maintain a consistent publishing schedule, but I realized that I was close to burnout.
I take my commitment to providing you with high-quality content very seriously, and I am not willing to sacrifice quality for consistency. That is why I had decided to take some time to rest and recharge to return to writing with a fresh perspective and renewed energy.
During my break, I had the opportunity to reflect on my priorities and come up with new ideas for the newsletter. I am excited to share them with you in the coming weeks and months.
I understand that you may have been disappointed by my sudden decision to take a break without any explanation. However, I hope you understand that this decision was made in the best interests of the newsletter in the long run. I am committed to returning stronger than ever before, and I look forward to continuing to provide you with the informative and engaging content that you have come to expect.
Thank you for your understanding and support.
Sincerely,
Harsha

The complexity of cells is genuinely astounding. From the outer membrane to the nucleus, countless tiny factories, transport mechanisms, production centres, export centres, and import centres work together to coordinate and supply vital information for survival. It's like a wonderfully designed supply chain that ensures the proper functioning of the cell.
This information flows from cell to tissue to organ promulgated through small molecules such as hormones and neurotransmitters. In a tissue, it is often vital to understand the positions of cells and what they are producing to decipher the unknown functions of a cell or a group of them in a particular location.
From a slightly historical perspective, researchers have been using experiments such as profiling for mRNAs and proteins in a subtractive manner where the cells are often isolated from said tissue section to understand their functions. But this, in turn, removes the contextuality of the cells exactly in the tissue.
A recent study addressed the puzzle of tiny molecules like neurotransmitters and metabolites. Antibody-based exploration of tissue sections and sequencing methods have been employed to understand molecular mechanisms in diseases.
In a nascent and burgeoning field of Spatial Biology, we have seen technology demonstrations such as DBiT-Seq and Slide-Seq, amongst many others, as a potential approach to studying cellular interactions in the context of a tissue.
Spatial multimodal analysis of transcriptomes and metabolites in tissues.
The paper by Marco Vicari and colleagues at the Science for Life Laboratory in Sweden has come up with an exciting new way to combine mass spectroscopy with imaging and spatial transcriptomics to measure the mRNA and low molecular weight metabolites across tissue regions precisely.
Let's explore this paper and discover the motivations and critical innovations behind it. By merging two distinct methods, the creators have developed a technique that provides a deeper contextual understanding of underlying processes. Together, we can envision the potential use cases and inspire innovative solutions.
A short primer on MALDI-MSI and SRT.
After watching some videos by Wired where scientists explain complex stuff in 5 different levels, I was inspired and decided to break down complex concepts as I would be explaining it to my nephew or niece. I know most of my audience and community members are likely to be well-versed in these concepts, I would like you to skip this part.
MALDI-MSI stands for matrix-assisted laser desorption/ionization mass spectrometry imaging. It's a big name, but we can break it into simpler parts.
Matrix-Assisted: Think of this as a helper. Like when you need someone to help you with your homework, scientists use a "matrix" to help them with their work. In this case, the matrix helps to make the tiny things they want to study easier to see.
Laser: Imagine a laser pointer you might use to play with your cat. But instead of playing, scientists use a special laser to shine a tiny beam of light on the thing they want to study.
Desorption: This is a big word, but it means making something turn into a gas. Imagine ice turning into water when it gets warm. In MALDI-MSI, the laser makes the small things they're looking at turn into a gas.
Ionization: When something turns into a gas, it can also turn into tiny charged particles called ions. These ions have an electric charge, like a tiny battery.
Mass Spectrometry: This is another big word, but it's like a scale that can weigh really, really tiny things. Instead of measuring how heavy something is, it measures the mass of those tiny charged particles (ions).
Imaging: Finally, after they weigh these ions, scientists can make a picture that shows where different types of ions are in the thing they're studying. It's like taking a picture with a special camera, but the picture shows where all these tiny ions are.
So, in simple terms, MALDI-MSI is a tool that helps scientists look at tiny things by using a laser to turn them into ions, weighing them, and then making a picture to see where they are. It's like using a super special microscope to see things that are too small for our eyes to see!
The researchers used an advanced version of this method, Fourier-transform ion cyclotron resonance-MALDI-MSI to perform their experiments. Akin to the explanation above FTICR can be described as :
Fourier-transform: Imagine you're playing with a spinning top. When the top spins, it makes a cool sound, right? Scientists use a trick called "Fourier-transform" to turn this sound into a special kind of picture or graph. It's like turning music into a picture.
Ion Cyclotron Resonance (ICR): This special machine can trap and spin tiny charged particles (ions) in circles using magnetic fields. It's like making ions dance in a circle!
What about Spatially resolved transcriptomics (SRT), you ask:
Genes: Our bodies have thousands of genes (Approximately 20,000 which code for proteins), which are like instruction manuals for making different parts of our bodies work.
Transcriptomics is a way to study which genes are "turned on" or "active" in a particular cell or part of an organism. When a gene is active, it's like someone following the instructions in a manual to build something.
Spatially Resolved: Imagine you have a map and want to know where different types of trees are in a forest. Spatially resolved transcriptomics is like mapping where different genes are active in a tissue, like a piece of the body or a plant leaf.
So, scientists use special tools and techniques to determine which genes are doing their jobs in different areas of a tissue or sample. This helps them understand how different parts of the body works and how they communicate with each other at the gene level. It's like being a gene detective, figuring out where the action is happening inside our bodies or in other living things!
Key Ideas and Validation
Spatially resolved transcriptomics (SRT) and Mass spectrometry imaging are two different tools that are being used on tissue to understand transcriptome and metabolome individually.
Currently, they are used as separate methods due to experimental constraints
The study provides a way to combine SRT and MALDI-MSI in a single tissue section with __with retained specificity and sensitivity of both modalities by introducing a Spatial Multimodal analysis protocol__
It has four steps:
Section and embed snap-frozen samples onto noncharged, barcode gene expression arrays (Visium glass slides).
MSI by MALDI
HE staining and bright field microscopy
Spatially resolved transcriptomics
Advantage: Workflow does not require modifications to commercially available Visium slides or Modifications to the MALDI-MSI or SRT protocols.
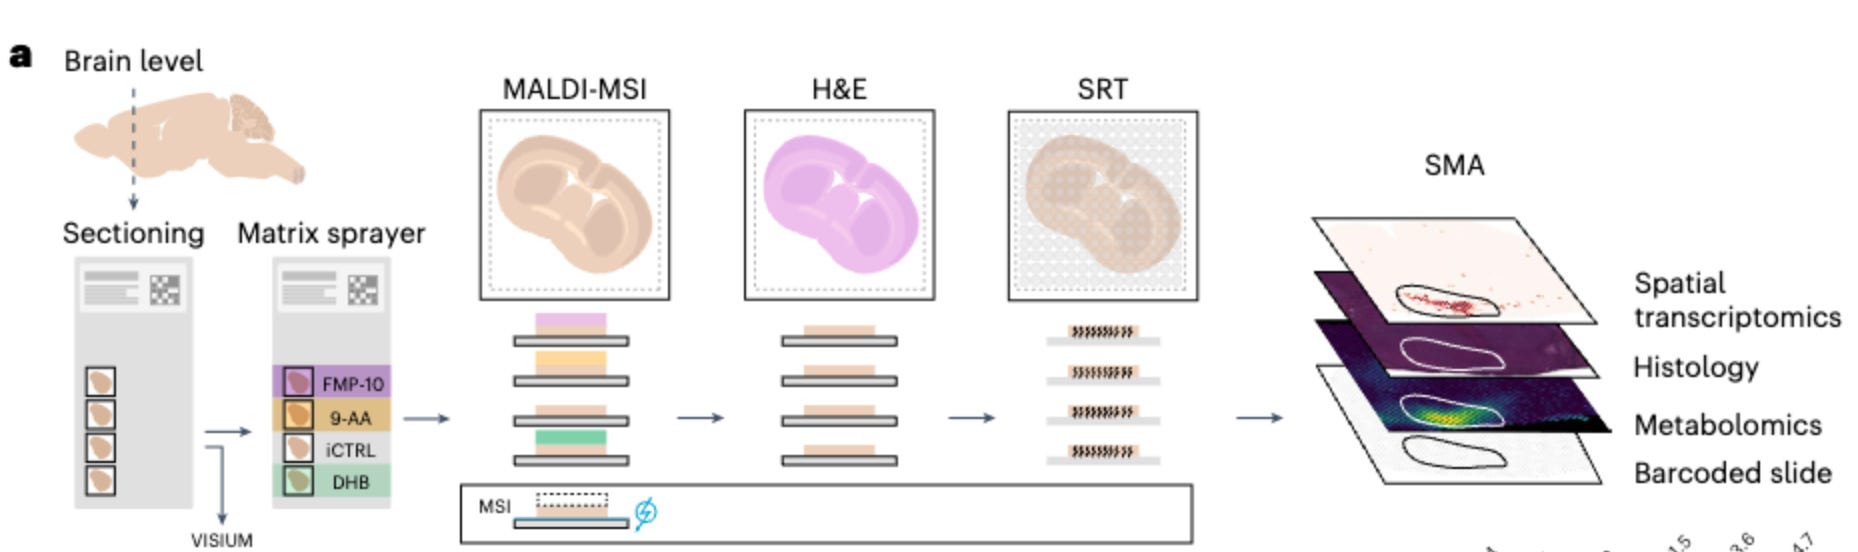

Tissue sections were imaged using Fourier-transform ion cyclotron resonance(FTICR)-MALDI MSI
High-field FTICR MS is a powerful tool that provides very precise measurements. It can accurately identify the molecular formula of a wide range of different molecules. This technology is able to cover all types of molecules and provide unambiguous results.
When we have accurate molecular mass measurements, we can more confidently identify the molecules. This is because measuring the mass with high accuracy and resolving power allows for precise determination of the exact mass of the molecule.
The results of the cDNA footprint imaging showed that the captured transcripts correlated well with tissue morphology. This indicates that mRNA is still present after MALDI-MSI in all of the tested matrices despite surprising expectations.
They used a technique called targeted in situ sequencing to confirm the presence of mRNA after performing MALDI on coronal sections of mice. FMP-10 on conductive MALDI slides was used for this process.
Researchers used Visium oligo slides to capture transcripts and conducted a reproducibility study. They examined seven coronal mouse sections from three different mice, imaged them with three different MALDI matrices, and compared MALDI-MSI and gene expression data from matching tissue sections. The results showed a good correlation with reference data. The joint analysis and visualization of the transcriptomics data demonstrated that gene expression integrated well across experimental conditions. The researchers observed a similar expression of marker genes and high conservation of the spatial clusters.

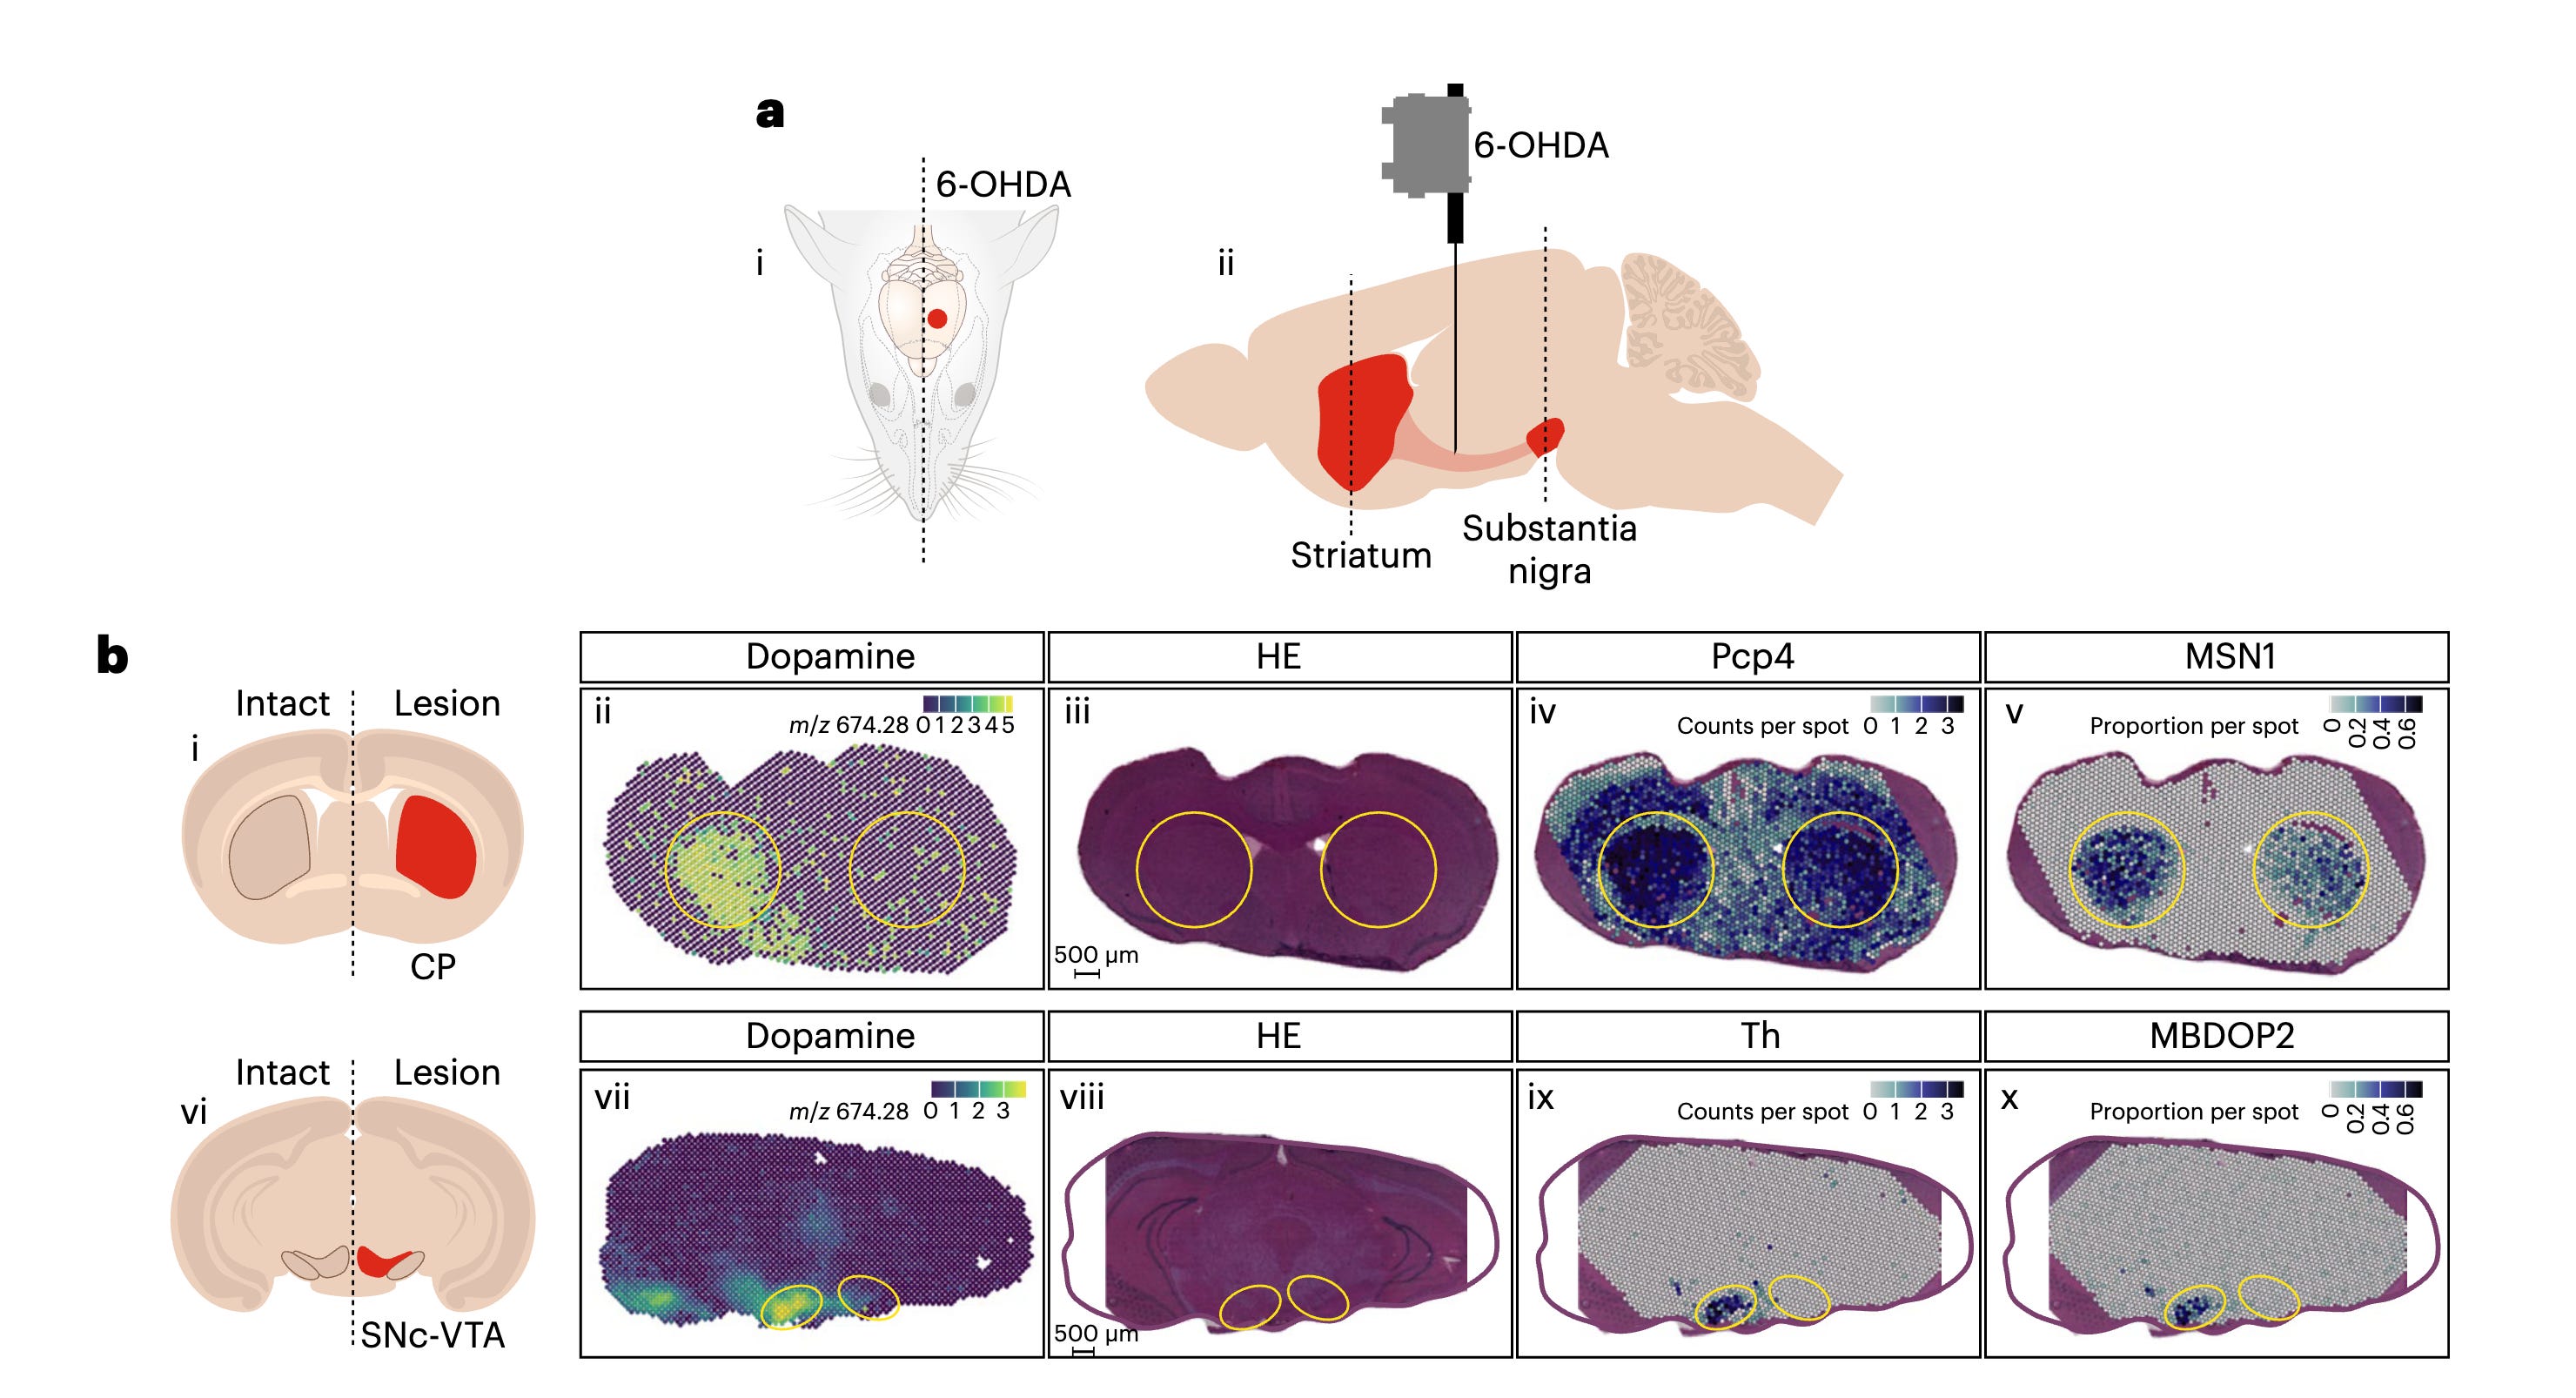
A well-established model in most spatial studies is to profile the brain regions due to the availability of high-quality reference data and mouse models. To this extent, They focussed their tech demonstration on a mouse model of Parkinson's disease. PD is characterised by the loss of dopaminergic neurons within substantia nigra pars compacta(SNc), where misfolded proteins clump together and due to the cell’s inability to remove the clumps, it becomes cytotoxic and damages the cells. Movement-associated symptoms occur once the disease, which likely starts in the medulla and reaches SNc.
In this study, the authors aimed to capture both gene expression and corresponding neurotransmitters from two brain regions of three mice with oxidopamine (6-OHDA), which is a synthetic compound used by researchers to selectively destroy dopaminergic and noradrenergic neurons in brain. Due to structural similarity with dopamine, the neurons cant distinguish and are taken up by them, where they are oxidised and produce few toxic products, leading to loss of the neurons in SNc.
In regions where the neurons were intact and unaffected by the lesioning (ie., Treating with 6-OHDA). SMA demonstrates dopamine present in intact striatum and SNc but not in the lesioned samples and by the use of Multimodality of SMA they confirm that key dopaminergic pathway genes are correlated with dopamine expression.
To identify exactly which cell types are lost by lesioning, they leveraged the mouse brain atlas scSEQ data and deconvoluted the samples. The deconvolution separates cell populations based on markers from a tissue section or a bulk RNA sequencing experiment. This led to the identification of loss of midbrain dopaminergic neurons in the lesioned SNc and Ventral tegmental area. They were also able to specify the localisation of multiple metabolites such as taurine, serotonin and histidine, to name a few.
The key advantage of this strategy is that one can measure the metabolites and the transcripts versus metabolites or transcripts alone.
Experiments in human postmortem sample
To demonstrate the relevance of this approach, they used a frozen human PD sample of the stratum (image below in Red)

Spatial MSI confirmed that dopamine and 3-methoxytyramine, neurotransmitters, were found at higher levels in the medial division of the ventral caudate nucleus.
Using a multimodal approach, SCG2, a protein-coding transcript involved in sorting peptide hormones and neuropeptides, was associated with dopamine abundance in secretory vesicles.
By performing cell-type deconvolution, they observed that MMSN.D1b neurons were enriched in the dopamine-expressing region with a spatial pattern similar to SCG2 in their PD model.

The authors' method revolutionises small molecule and gene expression profiling in tissue sections, offering a powerful tool for driving groundbreaking advancements in oncology and developmental biology. Its seamless implementation from existing 10x visium slides makes it a no-brainer for researchers across these fields. With this technology, scientists can easily conduct powerful in-vitro studies on organoids derived from tumours, exposing them to various small molecules as treatments. Researchers can measure changes in key metabolites and molecules in the microenvironment, unlocking invaluable insights and driving revolutionary discoveries.
References:
Spatial multimodal analysis of transcriptomes and metabolomes in tissues
Socials:
Lundberg Lab : Website
If you found the article valuable or enjoyable, please take a moment to leave a like and a comment below. Your support is very much appreciated and it motivates me to keep creating content that you love. Also, if you're feeling generous and would like to support my writing endeavors, please scan the QR code to make a donation and buy me a cup of coffee. Your contribution will help me continue producing helpful and engaging articles. Thank you for your support!
See you next week !!!
